Microsoft 2010 Annual Report Download - page 36
Download and view the complete annual report
Please find page 36 of the 2010 Microsoft annual report below. You can navigate through the pages in the report by either clicking on the pages listed below, or by using the keyword search tool below to find specific information within the annual report.-
 1
1 -
2
-
3
-
4
-
5
-
6
-
7
-
8
-
9
-
10
-
11
-
12
-
13
-
14
-
15
-
16
-
17
-
18
-
19
-
20
-
21
-
22
-
23
-
24
-
25
-
 26
26 -
 27
27 -
 28
28 -
 29
29 -
 30
30 -
 31
31 -
 32
32 -
 33
33 -
 34
34 -
 35
35 -
 36
36 -
 37
37 -
 38
38 -
 39
39 -
 40
40 -
 41
41 -
 42
42 -
 43
43 -
 44
44 -
 45
45 -
 46
46 -
47
-
48
-
49
-
50
-
51
-
52
-
53
-
54
-
55
-
56
-
57
-
58
-
59
-
60
-
61
-
62
-
63
-
64
-
65
-
66
-
67
-
68
-
69
-
70
-
71
-
72
-
73
-
74
-
75
-
76
-
77
-
78
-
79
-
80
 |
 |

35
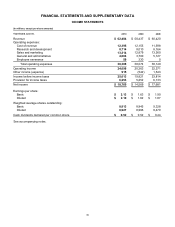
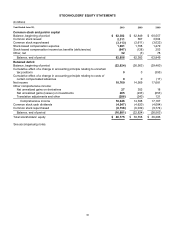
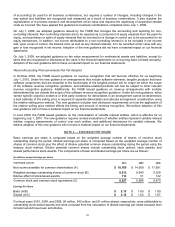
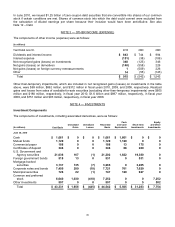
FINANCIAL STATEMENTS AND SUPPLEMENTARY DATA
INCOME STATEMENTS
(In millions, except per share amounts)
Y
ear Ended June 30, 2010
2009 2008
Revenue $ 62,484
$ 58,437 $ 60,420
Operating expenses:
Cost of revenue 12,395
12,155 11,598
Research and development 8,714
9,010 8,164
Sales and marketing 13,214
12,879 13,260
General and administrative 4,004
3,700 5,127
Employee severance 59
330 0
Total operating expenses 38,386
38,074 38,149
Operating income 24,098
20,363 22,271
Other income (expense) 915
(542) 1,543
Income before income taxes 25,013
19,821 23,814
Provision for income taxes 6,253
5,252 6,133
Net income $18,760
$ 14,569 $ 17,681
Earnings per share:
Basic $2.13
$ 1.63 $1.90
Diluted $2.10
$ 1.62 $1.87
Weighted average shares outstanding:
Basic 8,813
8,945 9,328
Diluted 8,927
8,996 9,470
Cash dividends declared per common share $0.52
$ 0.52 $0.44
See accompanying notes.