Microsoft 2010 Annual Report Download - page 67
Download and view the complete annual report
Please find page 67 of the 2010 Microsoft annual report below. You can navigate through the pages in the report by either clicking on the pages listed below, or by using the keyword search tool below to find specific information within the annual report.-
 1
1 -
2
-
3
-
4
-
5
-
6
-
7
-
8
-
9
-
10
-
11
-
12
-
13
-
14
-
15
-
16
-
17
-
18
-
19
-
20
-
21
-
22
-
23
-
24
-
25
-
26
-
27
-
28
-
29
-
30
-
31
-
32
-
33
-
34
-
35
-
36
-
37
-
38
-
39
-
40
-
41
-
42
-
43
-
44
-
45
-
46
-
47
-
48
-
49
-
50
-
51
-
52
-
53
-
54
-
55
-
56
-
 57
57 -
 58
58 -
 59
59 -
 60
60 -
 61
61 -
 62
62 -
 63
63 -
 64
64 -
 65
65 -
 66
66 -
 67
67 -
 68
68 -
 69
69 -
 70
70 -
 71
71 -
 72
72 -
 73
73 -
 74
74 -
 75
75 -
 76
76 -
 77
77 -
78
-
79
-
80
 |
 |

66
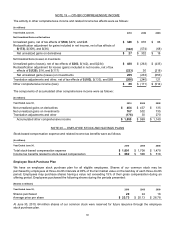
NOTE 19 — OTHER COMPREHENSIVE INCOME
The activity in other comprehensive income and related income tax effects were as follows:
(In millions)
Y
ear Ended June 30, 2010
2009 2008
Net Unrealized Gains on Derivatives
Unrealized gains, net of tax effects of $188, $472, and $46 $ 349
$ 876 $ 86
Reclassification adjustment for gains included in net income, net of tax effects of
$(173), $(309), and $(36) (322 )
(574) (68)
Net unrealized gains on derivatives $ 27
$ 302 $18
Net Unrealized Gains (Losses) on Investments
Unrealized gains (losses), net of tax effects of $263, $(142), and $(234) $ 488
$ (263) $ (435)
Reclassification adjustment for losses (gains) included in net income, net of tax
effects of $(120), $16, and $(117) (223 )
30 (218)
Net unrealized gains (losses) on investments 265
(233) (653)
Translation adjustments and other, net of tax effects of $(103), $(133), and $69 (206 )
(240) 121
Other comprehensive income (loss) $ 86
$ (171) $ (514)
The components of accumulated other comprehensive income were as follows:
(In millions)
Y
ear Ended June 30, 2010
2009 2008
Net unrealized gains on derivatives $464
$ 437 $ 135
Net unrealized gains on investments 767
502 735
Translation adjustments and other (176 )
30 270
Accumulated other comprehensive income $ 1,055
$ 969 $ 1,140
NOTE 20 — EMPLOYEE STOCK AND SAVINGS PLANS
Stock-based compensation expense and related income tax benefits were as follows:
(In millions)
Y
ear Ended June 30, 2010
2009 2008
Total stock-based compensation expense $ 1,891
$ 1,708 $ 1,479
Income tax benefits related to stock-based compensation $662
$ 598 $ 518
Employee Stock Purchase Plan
We have an employee stock purchase plan for all eligible employees. Shares of our common stock may be
purchased by employees at three-month intervals at 90% of the fair market value on the last day of each three-month
period. Employees may purchase shares having a value not exceeding 15% of their gross compensation during an
offering period. Employees purchased the following shares during the periods presented:
(Shares in millions)
Y
ear Ended June 30, 2010
2009 2008
Shares purchased 20
24 18
Average price per share $ 23.73
$ 20.13 $ 26.78
At June 30, 2010, 64 million shares of our common stock were reserved for future issuance through the employee
stock purchase plan.