Microsoft 2010 Annual Report Download - page 19
Download and view the complete annual report
Please find page 19 of the 2010 Microsoft annual report below. You can navigate through the pages in the report by either clicking on the pages listed below, or by using the keyword search tool below to find specific information within the annual report.-
 1
1 -
2
-
3
-
4
-
5
-
6
-
7
-
8
-
 9
9 -
 10
10 -
 11
11 -
 12
12 -
 13
13 -
 14
14 -
 15
15 -
 16
16 -
 17
17 -
 18
18 -
 19
19 -
 20
20 -
 21
21 -
 22
22 -
 23
23 -
 24
24 -
 25
25 -
 26
26 -
 27
27 -
 28
28 -
 29
29 -
30
-
31
-
32
-
33
-
34
-
35
-
36
-
37
-
38
-
39
-
40
-
41
-
42
-
43
-
44
-
45
-
46
-
47
-
48
-
49
-
50
-
51
-
52
-
53
-
54
-
55
-
56
-
57
-
58
-
59
-
60
-
61
-
62
-
63
-
64
-
65
-
66
-
67
-
68
-
69
-
70
-
71
-
72
-
73
-
74
-
75
-
76
-
77
-
78
-
79
-
80
 |
 |

18
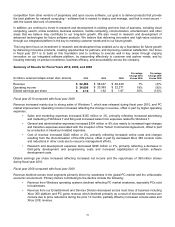
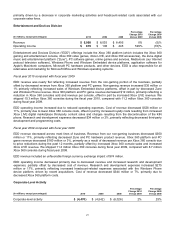
Windows Division revenue growth is largely correlated to the growth of PC purchases from original equipment
manufacturers (“OEMs”) that pre-install versions of Windows operating systems because the OEM channel accounts
for approximately 80% of total Windows Division revenue. The remaining approximately 20% of Windows Division
revenue (“other revenue”) is generated by commercial and retail sales of Windows and online advertising from
Windows Live.
Fiscal year 2010 compared with fiscal year 2009
Windows Division revenue increased primarily as a result of strong sales of Windows 7 and PC market improvement.
We estimate total PC shipments from all sources grew approximately 16% to 18%. OEM revenue increased $2.6
billion or 22%, while OEM license units increased 21%. The OEM revenue increase was driven by PC market growth,
higher Windows attach rates across consumer and business segments, the restoration of normal OEM inventory
levels, and the mix of versions of Windows licensed, offset in part by PC market changes, including stronger growth
of emerging markets versus developed markets and of consumer PCs versus business PCs. Fiscal year 2009 OEM
revenue reflects a $273 million Windows 7 Deferral, as discussed under Overview and Outlook above. This amount
was subsequently recognized in fiscal year 2010. Other revenue increased $912 million or 29% driven primarily by
Windows 7 retail sales.
Windows Division operating income increased as a result of increased revenue, offset in part by higher operating
expenses. Cost of revenue increased $296 million or 22%, primarily driven by royalties and other product costs.
Sales and marketing expenses increased $256 million or 11% reflecting increased advertising and marketing of
Windows 7.
Fiscal year 2009 compared with fiscal year 2008
Windows Division revenue decreased primarily as a result of PC market weakness, especially PCs sold to
businesses. OEM revenue decreased $2.3 billion or 16% while OEM license units declined 2%. Based on our
estimates, total worldwide PC shipments from all sources experienced a decline of approximately 1% to growth of
approximately 2%, driven by changes in demand in emerging and developed markets.
Windows Division operating income decreased primarily reflecting decreased revenue and increased sales and
marketing expenses. Sales and marketing expenses increased $100 million or 5%, primarily reflecting increased
advertising and marketing.
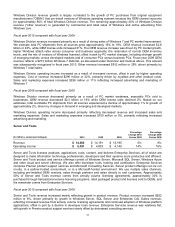
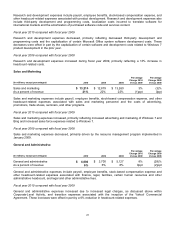
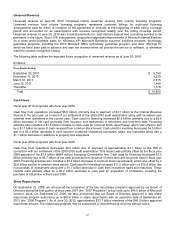
Server and Tools
(In millions, except percentages) 2010 2009 2008
Percentage
Change 2010
Versus 2009
Percentage
Change 2009
Versus 2008
Revenue $ 14,866 $ 14,191 $ 13,195
5% 8%
Operating income $5,491 $ 4,803 $ 4,149
14% 16%
Server and Tools licenses products, applications, tools, content, and delivers Enterprise Services, all of which are
designed to make information technology professionals, developers and their systems more productive and efficient.
Server and Tools product and service offerings consist of Windows Server, Microsoft SQL Server, Windows Azure
and other cloud and server offerings. We also offer developer tools, training and certification. Enterprise Services
comprise Premier product support services and Microsoft Consulting Services. Server product offerings can be run
on-site, in a partner-hosted environment, or in a Microsoft-hosted environment. We use multiple sales channels,
including pre-installed OEM versions, sales through partners and sales directly to end customers. Approximately
50% of Server and Tools revenue comes from annuity volume licensing agreements, approximately 30% is
purchased through transactional volume licensing programs, retail packaged product and licenses sold to OEMs, and
the remainder comes from Enterprise Services.
Fiscal year 2010 compared with fiscal year 2009
Server and Tools revenue increased mainly reflecting growth in product revenue. Product revenue increased $652
million or 6%, driven primarily by growth in Windows Server, SQL Server and Enterprise CAL Suites revenue,
reflecting increased revenue from annuity volume licensing agreements and continued adoption of Windows platform
applications, offset in part by a decline in developer tools revenue. Enterprise Services revenue was relatively flat,
with growth in Premier product support services nearly offset by decreased consulting services.