Microsoft 2010 Annual Report Download - page 47
Download and view the complete annual report
Please find page 47 of the 2010 Microsoft annual report below. You can navigate through the pages in the report by either clicking on the pages listed below, or by using the keyword search tool below to find specific information within the annual report.-
 1
1 -
2
-
3
-
4
-
5
-
6
-
7
-
8
-
9
-
10
-
11
-
12
-
13
-
14
-
15
-
16
-
17
-
18
-
19
-
20
-
21
-
22
-
23
-
24
-
25
-
26
-
27
-
28
-
29
-
30
-
31
-
32
-
33
-
34
-
35
-
36
-
 37
37 -
 38
38 -
 39
39 -
 40
40 -
 41
41 -
 42
42 -
 43
43 -
 44
44 -
 45
45 -
 46
46 -
 47
47 -
 48
48 -
 49
49 -
 50
50 -
 51
51 -
 52
52 -
 53
53 -
 54
54 -
 55
55 -
 56
56 -
 57
57 -
58
-
59
-
60
-
61
-
62
-
63
-
64
-
65
-
66
-
67
-
68
-
69
-
70
-
71
-
72
-
73
-
74
-
75
-
76
-
77
-
78
-
79
-
80
 |
 |

46
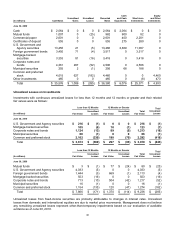
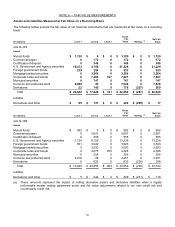
(In millions) Cost Basis
Unrealized
Gains
Unrealized
Losses
Recorded
Basis
Cash
and Cash
Equivalents
Short-term
Investments
Equity
and Other
Investments
June 30, 2009
Cash $ 2,064 $ 0 $0 $ 2,064 $ 2,064 $ 0 $0
Mutual funds 1,007
0 (25) 982 900
82 0
Commercial paper 2,601
0 0 2,601 400
2,201 0
Certificates of deposit 555
0 0 555 275
280 0
U.S. Government and
Agency securities 13,450
21 (5) 13,466 2,369
11,097 0
Foreign government bonds 3,450
71 (4) 3,517 0
3,517 0
Mortgage-backed
securities 3,353
81 (16) 3,418 0
3,418 0
Corporate notes and
bonds 4,361
287 (52) 4,596 0
4,596 0
Municipal securities 255
2 (1) 256 68
188 0
Common and preferred
stock 4,015
627 (182) 4,460 0
0 4,460
Other investments 465
0 0 465 0
(8) 473
Total $ 35,576
$ 1,089 $ (285) $ 36,380 $ 6,076
$ 25,371 $ 4,933
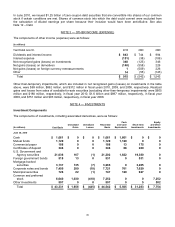
Unrealized Losses on Investments
Investments with continuous unrealized losses for less than 12 months and 12 months or greater and their related
fair values were as follows:
Less than 12 Months 12 Months or Greater
Total
Unrealized
Losses
(In millions) Fair Value
Unrealized
Losses Fair Value
Unrealized
Losses
Total
Fair Value
June 30, 2010
U.S. Government and Agency securities $216 $ (1) $ 0 $ 0
$ 216 $ (1)
Mortgage-backed securities 105 (6) 18 (1 )
123 (7)
Corporate notes and bonds 1,124 (13) 89 (5 )
1,213 (18)
Municipal securities 66 (1) 0 0
66 (1)
Common and preferred stock 2,102 (339) 190 (79 )
2,292 (418)
Total $ 3,613 $ (360) $ 297 $ (85 )
$ 3,910 $ (445)
Less than 12 Months 12 Months or Greater
Total
Unrealized
Losses
(In millions) Fair Value
Unrealized
Losses Fair Value
Unrealized
Losses
Total
Fair Value
June 30, 2009
Mutual funds $3 $(1)$77 $(24 ) $ 80 $(25)
U.S. Government and Agency securities 4,033 (5) 0 0
4,033 (5)
Foreign government bonds 1,444 (3) 669 (1 )
2,113 (4)
Mortgage-backed securities 503 (16) 0 0
503 (16)
Corporate notes and bonds 713 (10) 504 (42 )
1,217 (52)
Municipal securities 16 (1) 0 0
16 (1)
Common and preferred stock 1,154 (135) 120 (47 )
1,274 (182)
Total $ 7,866 $ (171) $ 1,370 $ (114 )
$ 9,236 $ (285)
Unrealized losses from fixed-income securities are primarily attributable to changes in interest rates. Unrealized
losses from domestic and international equities are due to market price movements. Management does not believe
any remaining unrealized losses represent other-than-temporary impairments based on our evaluation of available
evidence as of June 30, 2010.