Microsoft 2010 Annual Report Download - page 25
Download and view the complete annual report
Please find page 25 of the 2010 Microsoft annual report below. You can navigate through the pages in the report by either clicking on the pages listed below, or by using the keyword search tool below to find specific information within the annual report.-
 1
1 -
2
-
3
-
4
-
5
-
6
-
7
-
8
-
9
-
10
-
11
-
12
-
13
-
14
-
 15
15 -
 16
16 -
 17
17 -
 18
18 -
 19
19 -
 20
20 -
 21
21 -
 22
22 -
 23
23 -
 24
24 -
 25
25 -
 26
26 -
 27
27 -
 28
28 -
 29
29 -
 30
30 -
 31
31 -
 32
32 -
 33
33 -
 34
34 -
 35
35 -
36
-
37
-
38
-
39
-
40
-
41
-
42
-
43
-
44
-
45
-
46
-
47
-
48
-
49
-
50
-
51
-
52
-
53
-
54
-
55
-
56
-
57
-
58
-
59
-
60
-
61
-
62
-
63
-
64
-
65
-
66
-
67
-
68
-
69
-
70
-
71
-
72
-
73
-
74
-
75
-
76
-
77
-
78
-
79
-
80
 |
 |

24
Fiscal year 2009 compared with fiscal year 2008
General and administrative expenses decreased primarily reflecting decreased costs for legal settlements and legal
contingencies. We incurred legal charges of $283 million in fiscal year 2009, as compared with $1.8 billion during
fiscal year 2008. The fiscal year 2008 legal costs were primarily related to the European Commission fine of $1.4
billion (€899 million).
Employee Severance
In January 2009, we announced and implemented a resource management program to reduce employee headcount.
We completed this program in fiscal year 2010, reducing our overall headcount by approximately 5,300 in various
functions, including research and development, marketing, sales, finance, legal, human resources, and information
technology. During fiscal years 2010 and 2009, we recorded employee severance expense of $59 million and $330
million, respectively.
OTHER INCOME (EXPENSE) AND INCOME TAXES
Other Income (Expense)
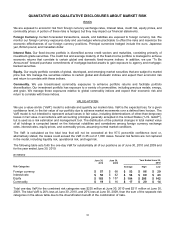
The components of other income (expense) were as follows:
(In millions, except percentages) 2010 2009 2008
Percentage
Change 2010
Versus 2009
Percentage
Change 2009
Versus 2008
Dividends and interest income $ 843 $ 744 $ 994 13% (25)%
Interest expense (151) (38) (106 )
(297)% 64%
Net recognized gains (losses) on investments 348 (125) 346
* *
Net gains (losses) on derivatives (140) (558) 226
75% *
Net gains (losses) on foreign currency
remeasurements 1 (509) 226
* *
Other 14 (56) (143 )
* 61%
Total $915 $ (542) $ 1,543
* *
* Not meaningful
We use derivative instruments to manage risks related to foreign currencies, equity prices, interest rates, and credit;
to enhance investment returns; and to facilitate portfolio diversification. Gains and losses from changes in fair values
of derivatives that are not designated as hedges are recognized in other income (expense). These are generally
offset by unrealized gains and losses in the underlying securities in the investment portfolio and are recorded as a
component of other comprehensive income.
Fiscal year 2010 compared with fiscal year 2009
Dividends and interest income increased primarily due to higher average portfolio investment balances, offset in part
by lower yields on our fixed-income investments. Interest expense increased due to our issuance of long term debt in
May 2009. Net recognized gains on investments increased primarily due to lower other-than-temporary impairments,
offset in part by lower gains on sales of investments in the current period. Other-than-temporary impairments were
$69 million during fiscal year 2010, as compared with $862 million during fiscal year 2009 and decreased primarily
due to improvements in market conditions. Net losses on derivatives decreased due to gains on equity and interest
rate derivatives as compared to losses in the prior period and lower losses on commodity and foreign currency
contracts in the current period. Net gains from foreign currency remeasurements were insignificant in fiscal year 2010
compared to net losses of $509 million in the prior year, which had resulted from the strengthening of the U.S. dollar
in the prior year. For fiscal year 2010, other includes a gain on the divestiture of Razorfish.
Fiscal year 2009 compared with fiscal year 2008
Dividends and interest income decreased primarily reflecting lower interest rates on our fixed-income investments.
Interest expense decreased due to lower average collateral balances on loaned securities and related rates. Net
recognized losses on investments increased primarily due to higher other-than-temporary impairments that were
partially offset by gains on sales of certain equity investments held in our strategic investments portfolio. Other-than-