Konica Minolta 2010 Annual Report Download - page 7
Download and view the complete annual report
Please find page 7 of the 2010 Konica Minolta annual report below. You can navigate through the pages in the report by either clicking on the pages listed below, or by using the keyword search tool below to find specific information within the annual report.-
 1
1 -
 2
2 -
 3
3 -
 4
4 -
 5
5 -
 6
6 -
 7
7 -
 8
8 -
 9
9 -
 10
10 -
 11
11 -
 12
12 -
 13
13 -
 14
14 -
 15
15 -
 16
16 -
 17
17 -
 18
18 -
19
-
20
-
21
-
22
-
23
-
24
-
25
-
26
-
27
-
28
-
29
-
30
-
31
-
32
-
33
-
34
-
35
-
36
-
37
-
38
-
39
-
40
-
41
-
42
-
43
-
44
-
45
-
46
-
47
-
48
-
49
-
50
-
51
-
52
-
53
-
54
-
55
-
56
-
57
-
58
 |
 |

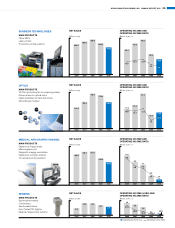
BUSINESS TECHNOLOGIES
MAIN PRODUCTS
Office MFPs
Laser printers
Production printing systems
OPTICS
MAIN PRODUCTS
TAC film (protecting film for polarizing plates)
Pickup lenses for optical discs
Glass substrates for hard-disk drives
Microcamera modules
MEDICAL AND GRAPHIC IMAGING
MAIN PRODUCTS
Digital x-ray image reader
Mammography unit
Diagnostic imaging workstation
Digital color-proofing systems
On-demand printing systems
SENSING
MAIN PRODUCTS
Spectrophotometers/
Colorimeters
Spectroradiometers
Non-Contact 3D Digitizer
Medical measurement systems
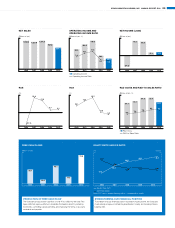
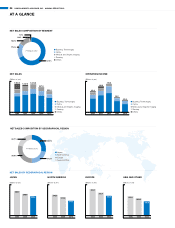
NET SALES
NET SALES
NET SALES
OPERATING INCOME AND
OPERATING INCOME RATIO
OPERATING INCOME AND
OPERATING INCOME RATIO
OPERATING INCOME AND
OPERATING INCOME RATIO
OPERATING INCOME (LOSS) AND
OPERATING INCOME RATIO
NET SALES
2006 2007 2008 2009 2010
110.3
138.9
182.2
173.4
136.7
2006 2007 2008 2009 2010
146.6
158.7 161.1
125.8
104.3
2006 2007 2008 2009 2010
5.8
10.0 9.9
8.3
6.9
2006 2007 2008 2009 2010
65.1
79.9
90.0
52.5
38.9
10.7 12.1 12.9
8.4 7.2
2006 2007 2008 2009 2010
17.5 21.0
31.2
12.5
14.3
15.9 15.1 17.1
7.2
10.5
2006 2007 2008 2009 2010
8.0
5.6 4.8
2.4
1.4
11.6
8.8
7.7
3.0
1.4
31.9
16.5 12.3
2006 2007 2008 2009 2010
1.8
1.6
1.2
0.3 (0.1)
(0.0)
4.2
(Billions of yen)
(Billions of yen)
(Billions of yen)
(Billions of yen, %)
(Billions of yen, %)
(Billions of yen, %)
(Billions of yen, %)
2006 2007 2008 2009 2010
606.7
658.6
700.9
623.6
540.8
(Billions of yen)
nn Operating Income (Loss)
n
Operating Income Ratio
KONICA MINOLTA HOLDINGS, INC. ANNUAL REPORT 2010 05