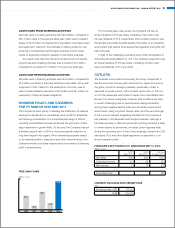
Konica Minolta 2010 Annual Report Download - page 38
Download and view the complete annual report
Please find page 38 of the 2010 Konica Minolta annual report below. You can navigate through the pages in the report by either clicking on the pages listed below, or by using the keyword search tool below to find specific information within the annual report.-
 1
1 -
2
-
3
-
4
-
5
-
6
-
7
-
8
-
9
-
10
-
11
-
12
-
13
-
14
-
15
-
16
-
17
-
18
-
19
-
20
-
21
-
22
-
23
-
24
-
25
-
26
-
27
-
 28
28 -
 29
29 -
 30
30 -
 31
31 -
 32
32 -
 33
33 -
 34
34 -
 35
35 -
 36
36 -
 37
37 -
 38
38 -
 39
39 -
 40
40 -
 41
41 -
 42
42 -
 43
43 -
 44
44 -
 45
45 -
 46
46 -
 47
47 -
 48
48 -
49
-
50
-
51
-
52
-
53
-
54
-
55
-
56
-
57
-
58
 |
 |

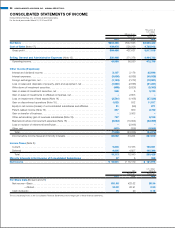
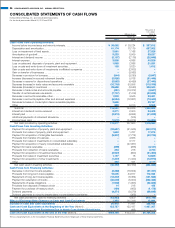
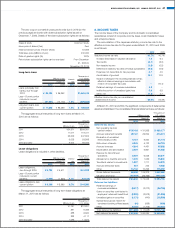
CONSOLIDATED STATEMENTS OF CASH FLOWS
Konica Minolta Holdings, Inc. and Consolidated Subsidiaries
For the fiscal years ended March 31, 2010 and 2009
Millions of yen
Thousands of
U.S. dollars
(Note 3)
March 31 March 31
2010 2009 2010
Cash Flows from Operating Activities:
Income before income taxes and minority interests . . . . . . . . . . . . . . . . . . . . . . . . . . . . ¥ 36,082 ¥ 33,224 $ 387,812
Depreciation and amortization . . . . . . . . . . . . . . . . . . . . . . . . . . . . . . . . . . . . . . . . . . . . 61,174 70,179 657,502
Loss on impairment of fixed assets . . . . . . . . . . . . . . . . . . . . . . . . . . . . . . . . . . . . . . . . 2,561 1,168 27,526
Amortization of goodwill . . . . . . . . . . . . . . . . . . . . . . . . . . . . . . . . . . . . . . . . . . . . . . . . 9,233 8,909 99,237
Interest and dividend income . . . . . . . . . . . . . . . . . . . . . . . . . . . . . . . . . . . . . . . . . . . . (2,107) (2,176) (22,646)
Interest expense . . . . . . . . . . . . . . . . . . . . . . . . . . . . . . . . . . . . . . . . . . . . . . . . . . . . . . 3,808 4,866 40,929
Loss on sales and disposals of property, plant and equipment . . . . . . . . . . . . . . . . . . . 1,980 2,866 21,281
Loss on sale and write-down of investment securities . . . . . . . . . . . . . . . . . . . . . . . . . . 150 3,820 1,612
Gain on sale and write-down of investments in affiliated companies . . . . . . . . . . . . . . . –(2,803) –
Gain on transfer of businesses . . . . . . . . . . . . . . . . . . . . . . . . . . . . . . . . . . . . . . . . . . . –(3,063) –
Decrease in provision for bonuses . . . . . . . . . . . . . . . . . . . . . . . . . . . . . . . . . . . . . . . . . (544) (3,290) (5,847)
Increase (decrease) in accrued retirement benefits . . . . . . . . . . . . . . . . . . . . . . . . . . . . (2,926) 5,708 (31,449)
Decrease in reserve for discontinued operations . . . . . . . . . . . . . . . . . . . . . . . . . . . . . . (2,553) (4,459) (27,440)
Decrease (increase) in trade notes and accounts receivable . . . . . . . . . . . . . . . . . . . . . (10,718) 50,596 (115,198)
Decrease (increase) in inventories . . . . . . . . . . . . . . . . . . . . . . . . . . . . . . . . . . . . . . . . . 28,688 (3,550) 308,340
Decrease in trade notes and accounts payable . . . . . . . . . . . . . . . . . . . . . . . . . . . . . . . (451) (10,372) (4,847)
Transfer of rental business-use assets . . . . . . . . . . . . . . . . . . . . . . . . . . . . . . . . . . . . . . (7,707) (7,419) (82,835)
Decrease in accounts receivable–other . . . . . . . . . . . . . . . . . . . . . . . . . . . . . . . . . . . . . 1,900 4,545 20,421
Decrease in accounts payable–other and accrued expenses . . . . . . . . . . . . . . . . . . . . (6,554) (12,821) (70,443)
Decrease/increase in consumption taxes receivable/payable. . . . . . . . . . . . . . . . . . . . . 3,646 –39,187
Other . . . . . . . . . . . . . . . . . . . . . . . . . . . . . . . . . . . . . . . . . . . . . . . . . . . . . . . . . . . . . . 889 9,010 9,555
Subtotal . . . . . . . . . . . . . . . . . . . . . . . . . . . . . . . . . . . . . . . . . . . . . . . . . . . . . . . . . . 116,551 144,939 1,252,698
Interest and dividend income received . . . . . . . . . . . . . . . . . . . . . . . . . . . . . . . . . . . . . 2,271 2,000 24,409
Interest paid . . . . . . . . . . . . . . . . . . . . . . . . . . . . . . . . . . . . . . . . . . . . . . . . . . . . . . . . . (3,874) (4,594) (41,638)
Additional payments of retirement allowance . . . . . . . . . . . . . . . . . . . . . . . . . . . . . . . . . –(105) –
Income taxes paid . . . . . . . . . . . . . . . . . . . . . . . . . . . . . . . . . . . . . . . . . . . . . . . . . . . . . (1,572) (34,676) (16,896)
Net cash provided by operating activities . . . . . . . . . . . . . . . . . . . . . . . . . . . . . . . . . . 113,377 107,563 1,218,583
Cash Flows from Investing Activities:
Payment for acquisition of property, plant and equipment . . . . . . . . . . . . . . . . . . . . . . . (33,687) (61,645) (362,070)
Proceeds from sales of property, plant and equipment . . . . . . . . . . . . . . . . . . . . . . . . . 1,663 1,767 17,874
Payment for acquisition of intangible fixed assets . . . . . . . . . . . . . . . . . . . . . . . . . . . . . (5,837) (7,774) (62,736)
Proceeds from transfer of business . . . . . . . . . . . . . . . . . . . . . . . . . . . . . . . . . . . . . . . . –4,585 –
Proceeds from sales of investments in consolidated subsidiary . . . . . . . . . . . . . . . . . . . –3,177 –
Payment for acquisition of newly consolidated subsidiaries . . . . . . . . . . . . . . . . . . . . . . –(27,987) –
Payment for loans receivable . . . . . . . . . . . . . . . . . . . . . . . . . . . . . . . . . . . . . . . . . . . . . (296) (286) (3,181)
Proceeds from collection of loans receivable . . . . . . . . . . . . . . . . . . . . . . . . . . . . . . . . . 254 216 2,730
Payment for acquisition of investment securities . . . . . . . . . . . . . . . . . . . . . . . . . . . . . . (2,927) (990) (31,460)
Proceeds from sales of investment securities . . . . . . . . . . . . . . . . . . . . . . . . . . . . . . . . 1,197 18 12,865
Payment for acquisition of other investments . . . . . . . . . . . . . . . . . . . . . . . . . . . . . . . . (1,207) (1,440) (12,973)
Other . . . . . . . . . . . . . . . . . . . . . . . . . . . . . . . . . . . . . . . . . . . . . . . . . . . . . . . . . . . . . . 383 191 4,117
Net cash used in investing activities . . . . . . . . . . . . . . . . . . . . . . . . . . . . . . . . . . . . . . (40,457) (90,169) (434,834)
Cash Flows from Financing Activities:
Decrease in short-term loans payable . . . . . . . . . . . . . . . . . . . . . . . . . . . . . . . . . . . . . . (6,266) (16,504) (67,347)
Proceeds from long-term loans payable . . . . . . . . . . . . . . . . . . . . . . . . . . . . . . . . . . . . 16,005 44,817 172,023
Repayment of long-term loans payable . . . . . . . . . . . . . . . . . . . . . . . . . . . . . . . . . . . . . (12,237) (6,364) (131,524)
Payment for redemption of bonds . . . . . . . . . . . . . . . . . . . . . . . . . . . . . . . . . . . . . . . . . (30,000) (5,000) (322,442)
Repayments of lease obligations . . . . . . . . . . . . . . . . . . . . . . . . . . . . . . . . . . . . . . . . . . (1,938) (1,993) (20,830)
Proceeds from disposal of treasury stock . . . . . . . . . . . . . . . . . . . . . . . . . . . . . . . . . . . 14 218 150
Payment for purchase of treasury stock . . . . . . . . . . . . . . . . . . . . . . . . . . . . . . . . . . . . (109) (665) (1,172)
Dividend payments . . . . . . . . . . . . . . . . . . . . . . . . . . . . . . . . . . . . . . . . . . . . . . . . . . . . (9,271) (9,279) (99,645)
Dividend payments to minority shareholders in consolidated subsidiaries . . . . . . . . . . . –(268) –
Net cash provided by (used in) financing activities . . . . . . . . . . . . . . . . . . . . . . . . . . . (43,803) 4,959 (470,798)
Effect of Exchange Rate Changes on Cash and Cash Equivalents . . . . . . . . . . . . . 1,302 (11,311) 13,994
Increase in Cash and Cash Equivalents . . . . . . . . . . . . . . . . . . . . . . . . . . . . . . . . . . . 30,418 11,041 326,935
Cash and Cash Equivalents at the Beginning of the Year (Note 4) . . . . . . . . . . . . . . 133,727 122,187 1,437,307
Increase in Cash and Cash Equivalents Due to Newly Consolidated Subsidiaries . . –498 –
Cash and Cash Equivalents at the End of the Year (Note 4) . . . . . . . . . . . . . . . . . . . . ¥164,146 ¥133,727 $1,764,252
The accompanying Notes to the Consolidated Financial Statements are an integral part of these financial statements.
36 KONICA MINOLTA HOLDINGS, INC. ANNUAL REPORT 2010