Konica Minolta 2010 Annual Report Download - page 30
Download and view the complete annual report
Please find page 30 of the 2010 Konica Minolta annual report below. You can navigate through the pages in the report by either clicking on the pages listed below, or by using the keyword search tool below to find specific information within the annual report.-
 1
1 -
2
-
3
-
4
-
5
-
6
-
7
-
8
-
9
-
10
-
11
-
12
-
13
-
14
-
15
-
16
-
17
-
18
-
19
-
 20
20 -
 21
21 -
 22
22 -
 23
23 -
 24
24 -
 25
25 -
 26
26 -
 27
27 -
 28
28 -
 29
29 -
 30
30 -
 31
31 -
 32
32 -
 33
33 -
 34
34 -
 35
35 -
 36
36 -
 37
37 -
 38
38 -
 39
39 -
 40
40 -
41
-
42
-
43
-
44
-
45
-
46
-
47
-
48
-
49
-
50
-
51
-
52
-
53
-
54
-
55
-
56
-
57
-
58
 |
 |

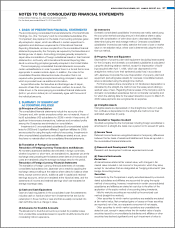
GROUP OVERVIEW
The Konica Minolta Group (the Group) consists of the Company,
Konica Minolta Holdings, Inc., 96 consolidated subsidiaries, 18
non-consolidated subsidiaries, and 7 affiliated companies. The
Group’s core business operations are Business Technologies,
Optics, Medical and Graphic Imaging, and Sensing, all of which the
Group operates on a global basis.
BUSINESS ENVIRONMENT
The domestic and global economic environment during the fiscal
year ended March 31, 2010 (FY March 2010) saw weakness in the
global economy grow more pronounced as fallout from the credit
crunch triggered by the financial crisis that struck in the fall of 2008
adversely impacted the real economy. This development, in turn,
spurred a troubling cycle of lackluster consumer spending, produc-
tion cutbacks, and worsening employment prospects. A reprieve
from this relentless picture would eventually come from successful
policies and economic stimulus measures employed by treasuries
and governments worldwide in a bid to restore financial stability.
But although signs of an economic recovery gradually emerged
from the second half of the year, the recovery remained weak as
controlled capital investment in the corporate sector and limited
credit availability persisted. The yen, moreover, settled at a high
level of appreciation in the currency markets. This trend had a
severe impact on the Konica Minolta Group with a high percentage
of sales outside of Japan, and became one of the factors that put
substantial pressure on business earnings for the year.
MANAGEMENT POLICY <09-10>
The Group recognized that the radical changes in the aforemen-
tioned market environment represented more than a temporary
economic slowdown. Instead, these changes appear to be the turn-
ing point of a massive and global socioeconomic transformation.
Seizing the moment as an opportunity to enhance its value, the
Group sought to achieve more vigorous growth with the formulation
of MANAGEMENT POLICY <09-10>. The key policies comprising
this two-year management plan spanning FY March 2010 to FY
March 2011 are (1) Execute structural reforms, (2) Achieve strong
growth, and (3) Reform the corporate culture. During the fiscal year
under review, the initial year of the plan’s enactment, the Group
pursued bold reforms designed to achieve a robust corporate struc-
ture; one capable of generating free cash flow irrespective of the
outlook for sales growth in a harsh business climate.
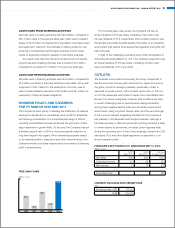
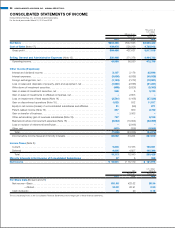
OPERATING RESULTS
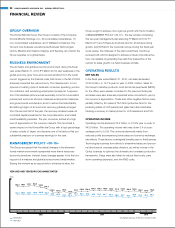
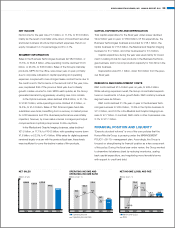
NET SALES
In the fiscal year ended March 31, 2010, net sales decreased
¥143.3 billion, or 15.1% year on year, to ¥804.4 billion. Sales for
the Group’s mainstay products, multi-functional peripherals (MFPs)
for the office, were weaker compared to the previous fiscal year,
and sales were also adversely impacted when converted to yen by
the currency’s appreciation. These and other negative factors were
partially offset by firm sales of TAC films (protective films for the
polarizing plates of LCD panels) and glass hard disk substrates,
tracking a recovery in market prices for LCD televisions and PCs.
OPERATING INCOME
Operating income declined ¥12.2 billion, or 21.8% year on year, to
¥43.9 billion. The operating income ratio was down 0.4 of a per-
centage point to 5.5%. This outcome stemmed mainly from
reduced profits accompanying lower sales and currency exchange
rate effects. These factors outweighed benefits seen in the Business
Technologies business from efforts to streamline bases and person-
nel structures at overseas sales divisions, as well as moves in the
Optics business to optimize the domestic and overseas production
frameworks. Steps were also taken to reduce fixed costs, pare
down operating expenses, and trim R&D costs.
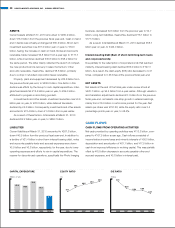
4
162.2
5
164.1
6
167.1
7
168.2
8
159.5
9
149.7
10
125.2
11
121.2
12
127.0
1
115.0
2
123.7
3
130.9
4
130.4
5
134.8
6
135.2
7
134.9
8
133.3
9
131.3
10
132.6
11
129.6
12
132.5
1
125.2
2
121.0
3
126.3
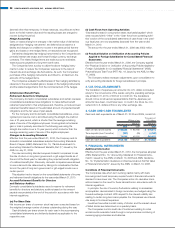
103.9 105.5 106.1 107.8 108.8 106.0 98.4 95.5 90.3 90.0 97.6 98.8 98.6 95.3 96.3 94.7 93.0 89.8 90.1 86.3 92.5 90.3 88.8 93.5
2008 2009 2010
YEN/USD AND YEN/EURO EXCHANGE RATES*
(Yen)
n
Yen/EURO
n
Yen/USD
* Exchange rates as of the end of each month.
FINANCIAL REVIEW
28 KONICA MINOLTA HOLDINGS, INC. ANNUAL REPORT 2010