Konica Minolta 2010 Annual Report Download - page 42
Download and view the complete annual report
Please find page 42 of the 2010 Konica Minolta annual report below. You can navigate through the pages in the report by either clicking on the pages listed below, or by using the keyword search tool below to find specific information within the annual report.-
 1
1 -
2
-
3
-
4
-
5
-
6
-
7
-
8
-
9
-
10
-
11
-
12
-
13
-
14
-
15
-
16
-
17
-
18
-
19
-
20
-
21
-
22
-
23
-
24
-
25
-
26
-
27
-
28
-
29
-
30
-
31
-
 32
32 -
 33
33 -
 34
34 -
 35
35 -
 36
36 -
 37
37 -
 38
38 -
 39
39 -
 40
40 -
 41
41 -
 42
42 -
 43
43 -
 44
44 -
 45
45 -
 46
46 -
 47
47 -
 48
48 -
 49
49 -
 50
50 -
 51
51 -
 52
52 -
53
-
54
-
55
-
56
-
57
-
58
 |
 |

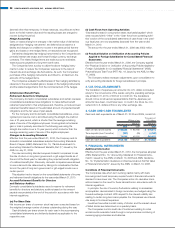
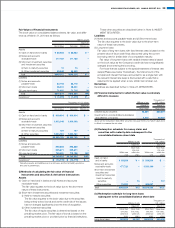
6. INVESTMENT SECURITIES
As of March 31, 2010
(1) Other Securities with Quoted Market Values
Millions of yen
Market value
at the consoli-
dated balance
sheet date
Original
purchase
value
Unrealized
gains
(losses)
Securities for which the amounts in the consolidated balance sheet
exceed the original purchase value
(1) Shares ¥11,044 ¥ 7,862 ¥ 3,182
(2) Bonds – – –
(3) Other
(i) Short-term investment
securities
(Negotiable deposits) – – –
(ii) Other 13 11 1
Subtotal ¥11,058 ¥ 7,874 ¥ 3,183
Millions of yen
Market value
at the consoli-
dated balance
sheet date
Original
purchase
value
Unrealized
gains
(losses)
Securities for which the amounts in the consolidated balance sheet
do not exceed the original purchase value
(1) Shares ¥ 5,786 ¥ 7,745 ¥(1,959)
(2) Bonds – – –
(3) Other
(i) Short-term investment
securities
(Negotiable deposits) 79,000 79,000 –
(ii) Other 3 4 (1)
Subtotal ¥84,789 ¥86,750 ¥(1,960)
Total ¥95,848 ¥94,624 ¥ 1,223
Thousands of U.S. dollars
Total $1,030,181 $1,017,025 $13,145
(2) Other Securities Sold during the Year Ended March 31, 2010
Millions of yen
Sale value Total profit Total loss
Shares ¥1,197 ¥ 699 ¥ 351
Thousands of U.S. dollars
Sale value Total profit Total loss
Shares $12,865 $7,513 $3,773
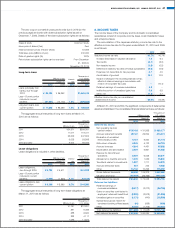
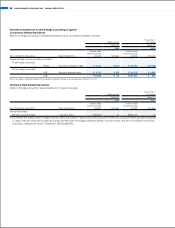
(3) Securities for Which Loss on Impairment is Recognized
The Companies have recognized loss on impairment of ¥499 million
($5,363 thousand) for securities for the year ended March 31, 2010.
For securities with quoted market values, if the market value has
declined by more than 50% compared with the acquisition cost at the
end of the period, or if the market value has declined by more than 30%
but not more than 50% compared with the acquisition cost at the end of
the period for two years in succession and has declined more than in the
preceding year, the Companies record the impairment loss, taking into
consideration recoverability and other factors, assuming that the market
value has “significantly declined.”
For securities without quoted market values, if the net assets per
share have fallen by more than 50% compared with the acquisition
cost, the Companies process the impairment loss, assuming that the
market value has “significantly declined.”
As of March 31, 2009
(1) Other Securities with Quoted Market Values
Millions of yen
Original
purchase
value
Market value
at the consoli-
dated balance
sheet date
Unrealized
gains
(losses)
Securities for which the amounts on the consolidated balance sheets
exceed the original purchase value
(1) Shares ¥ 7,287 ¥ 8,823 ¥ 1,536
(2) Bonds – – –
(3) Other 8 8 0
Subtotal ¥ 7,295 ¥ 8,832 ¥ 1,536
Millions of yen
Original
purchase
value
Market value
at the consoli-
dated balance
sheet date
Unrealized
gains
(losses)
Securities for which the amounts on the consolidated balance sheets do not
exceed the original purchase value
(1) Shares ¥ 8,426 ¥ 6,031 ¥(2,395)
(2) Bonds – – –
(3) Other 8 6 (1)
Subtotal ¥ 8,435 ¥ 6,037 ¥(2,397)
Total ¥15,730 ¥14,869 ¥ (861)
(2) Other Securities Sold during the Year Ended March 31, 2009
Millions of yen
Sale value Total profit Total loss
Other securities ¥15 ¥6 ¥0
(3) Composition and Amounts on the Consolidated Balance
Sheets of Other Securities without Market Values
Millions of yen
Negotiable deposits ¥48,000
Unlisted stocks 648
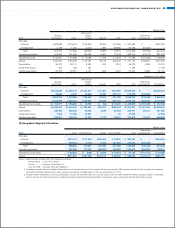
7. SHORT-TERM DEBT, LONG-TERM DEBT AND
LEASE OBLIGATIONS
Short-term debt is primarily unsecured and generally represents
bank overdrafts. The amounts as of March 31, 2010 and 2009 were
¥58,231 million ($625,871 thousand) and ¥64,980 million, respectively,
with the weighted-average interest rates approximately 1.1% and
1.8%, respectively.
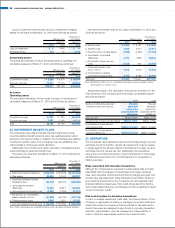
Long-term debt as of March 31, 2010 and 2009, including the cur-
rent portion, consisted of the following:
Bonds
Millions of yen
Thousands of
U.S. dollars
March 31 March 31
2010 2009 2010
Zero coupon convertible
unsecured bonds due in 2009 ¥ – ¥ 30,066 $ –
Zero coupon convertible
unsecured bonds due in 2016 40,000 40,000 429,923
¥40,000 ¥ 70,066 $429,923
Less—Current portion included
in current liabilities –(30,066) –
Bonds, less current portion ¥40,000 ¥ 40,000 $429,923
40 KONICA MINOLTA HOLDINGS, INC. ANNUAL REPORT 2010