Konica Minolta 2010 Annual Report Download - page 36
Download and view the complete annual report
Please find page 36 of the 2010 Konica Minolta annual report below. You can navigate through the pages in the report by either clicking on the pages listed below, or by using the keyword search tool below to find specific information within the annual report.-
 1
1 -
2
-
3
-
4
-
5
-
6
-
7
-
8
-
9
-
10
-
11
-
12
-
13
-
14
-
15
-
16
-
17
-
18
-
19
-
20
-
21
-
22
-
23
-
24
-
25
-
 26
26 -
 27
27 -
 28
28 -
 29
29 -
 30
30 -
 31
31 -
 32
32 -
 33
33 -
 34
34 -
 35
35 -
 36
36 -
 37
37 -
 38
38 -
 39
39 -
 40
40 -
 41
41 -
 42
42 -
 43
43 -
 44
44 -
 45
45 -
 46
46 -
47
-
48
-
49
-
50
-
51
-
52
-
53
-
54
-
55
-
56
-
57
-
58
 |
 |

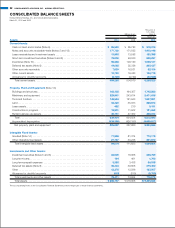
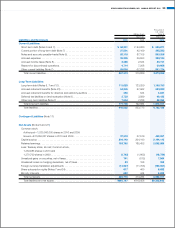
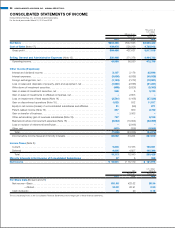
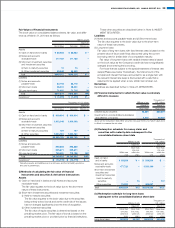
CONSOLIDATED STATEMENTS OF INCOME
Konica Minolta Holdings, Inc. and Consolidated Subsidiaries
For the fiscal years ended March 31, 2010 and 2009
Millions of yen
Thousands of
U.S. dollars
(Note 3)
March 31 March 31
2010 2009 2010
Net Sales . . . . . . . . . . . . . . . . . . . . . . . . . . . . . . . . . . . . . . . . . . . . . . . . . . . . . . . . . . . . ¥804,465 ¥947,843 $8,646,442
Cost of Sales (Note 17) . . . . . . . . . . . . . . . . . . . . . . . . . . . . . . . . . . . . . . . . . . . . . . . . . . 439,978 520,206 4,728,912
Gross profit . . . . . . . . . . . . . . . . . . . . . . . . . . . . . . . . . . . . . . . . . . . . . . . . . . . . . . . . . . 364,486 427,637 3,917,519
Selling, General and Administrative Expenses (Note 13) . . . . . . . . . . . . . . . . . . . . . . 320,498 371,376 3,444,733
Operating income . . . . . . . . . . . . . . . . . . . . . . . . . . . . . . . . . . . . . . . . . . . . . . . . . . . . . 43,988 56,260 472,786
Other Income (Expenses):
Interest and dividend income . . . . . . . . . . . . . . . . . . . . . . . . . . . . . . . . . . . . . . . . . . . . 2,107 2,176 22,646
Interest expenses . . . . . . . . . . . . . . . . . . . . . . . . . . . . . . . . . . . . . . . . . . . . . . . . . . . . . (3,808) (4,866) (40,929)
Foreign exchange loss, net . . . . . . . . . . . . . . . . . . . . . . . . . . . . . . . . . . . . . . . . . . . . . . (1,124) (7,272) (12,081)
Loss on sales and disposals of property, plant and equipment, net . . . . . . . . . . . . . . . . (1,980) (2,866) (21,281)
Write-down of investment securities . . . . . . . . . . . . . . . . . . . . . . . . . . . . . . . . . . . . . . . (499) (3,826) (5,363)
Gain on sales of investment securities, net . . . . . . . . . . . . . . . . . . . . . . . . . . . . . . . . . . 348 53,740
Gain on sales of investments in affiliated companies, net . . . . . . . . . . . . . . . . . . . . . . . . –2,803 –
Loss on impairment of fixed assets (Note 14) . . . . . . . . . . . . . . . . . . . . . . . . . . . . . . . . (2,561) (1,168) (27,526)
Gain on discontinued operations (Note 15) . . . . . . . . . . . . . . . . . . . . . . . . . . . . . . . . . . 1,025 932 11,017
Equity in net income (losses) of unconsolidated subsidiaries and affiliates . . . . . . . . . . . 81 (99) 871
Patent-related income (Note 16) . . . . . . . . . . . . . . . . . . . . . . . . . . . . . . . . . . . . . . . . . . 257 560 2,762
Gain on transfer of business . . . . . . . . . . . . . . . . . . . . . . . . . . . . . . . . . . . . . . . . . . . . . –3,063 –
Other extraordinary gain of overseas subsidiaries (Note 19) . . . . . . . . . . . . . . . . . . . . . . 757 –8,136
Business structure improvement expenses (Note 18) . . . . . . . . . . . . . . . . . . . . . . . . . . (2,084) (10,094) (22,399)
Loss on revision of retirement benefit plan . . . . . . . . . . . . . . . . . . . . . . . . . . . . . . . . . . . –(2,046) –
Other, net . . . . . . . . . . . . . . . . . . . . . . . . . . . . . . . . . . . . . . . . . . . . . . . . . . . . . . . . . . . (425) (336) (4,568)
Total . . . . . . . . . . . . . . . . . . . . . . . . . . . . . . . . . . . . . . . . . . . . . . . . . . . . . . . . . . . . . (7,906) (23,035) (84,974)
Income before income taxes and minority interests . . . . . . . . . . . . . . . . . . . . . . . . . . . . 36,082 33,224 387,812
Income Taxes (Note 8):
Current . . . . . . . . . . . . . . . . . . . . . . . . . . . . . . . . . . . . . . . . . . . . . . . . . . . . . . . . . . . . . 9,306 13,183 100,021
Deferred . . . . . . . . . . . . . . . . . . . . . . . . . . . . . . . . . . . . . . . . . . . . . . . . . . . . . . . . . . . . 9,806 4,857 105,396
Total . . . . . . . . . . . . . . . . . . . . . . . . . . . . . . . . . . . . . . . . . . . . . . . . . . . . . . . . . . . . . 19,113 18,040 205,428
Minority Interests in Net Income of Consolidated Subsidiaries . . . . . . . . . . . . . . . . 37 5398
Net Income . . . . . . . . . . . . . . . . . . . . . . . . . . . . . . . . . . . . . . . . . . . . . . . . . . . . . . . . . . . ¥ 16,931 ¥ 15,179 $ 181,975
Yen
U.S. dollars
(Note 3)
March 31 March 31
2010 2009 2010
Per Share Data (Notes 9 and 27):
Net income—Basic . . . . . . . . . . . . . . . . . . . . . . . . . . . . . . . . . . . . . . . . . . . . . . . . . . . . ¥31.93 ¥28.62 $0.34
—Diluted . . . . . . . . . . . . . . . . . . . . . . . . . . . . . . . . . . . . . . . . . . . . . . . . . . . 30.32 26.91 0.33
Cash dividends . . . . . . . . . . . . . . . . . . . . . . . . . . . . . . . . . . . . . . . . . . . . . . . . . . . . . . . 15 20 0.16
The accompanying Notes to the Consolidated Financial Statements are an integral part of these financial statements.
34 KONICA MINOLTA HOLDINGS, INC. ANNUAL REPORT 2010