Konica Minolta 2010 Annual Report Download - page 52
Download and view the complete annual report
Please find page 52 of the 2010 Konica Minolta annual report below. You can navigate through the pages in the report by either clicking on the pages listed below, or by using the keyword search tool below to find specific information within the annual report.-
 1
1 -
2
-
3
-
4
-
5
-
6
-
7
-
8
-
9
-
10
-
11
-
12
-
13
-
14
-
15
-
16
-
17
-
18
-
19
-
20
-
21
-
22
-
23
-
24
-
25
-
26
-
27
-
28
-
29
-
30
-
31
-
32
-
33
-
34
-
35
-
36
-
37
-
38
-
39
-
40
-
41
-
 42
42 -
 43
43 -
 44
44 -
 45
45 -
 46
46 -
 47
47 -
 48
48 -
 49
49 -
 50
50 -
 51
51 -
 52
52 -
 53
53 -
 54
54 -
 55
55 -
 56
56 -
 57
57 -
 58
58
 |
 |
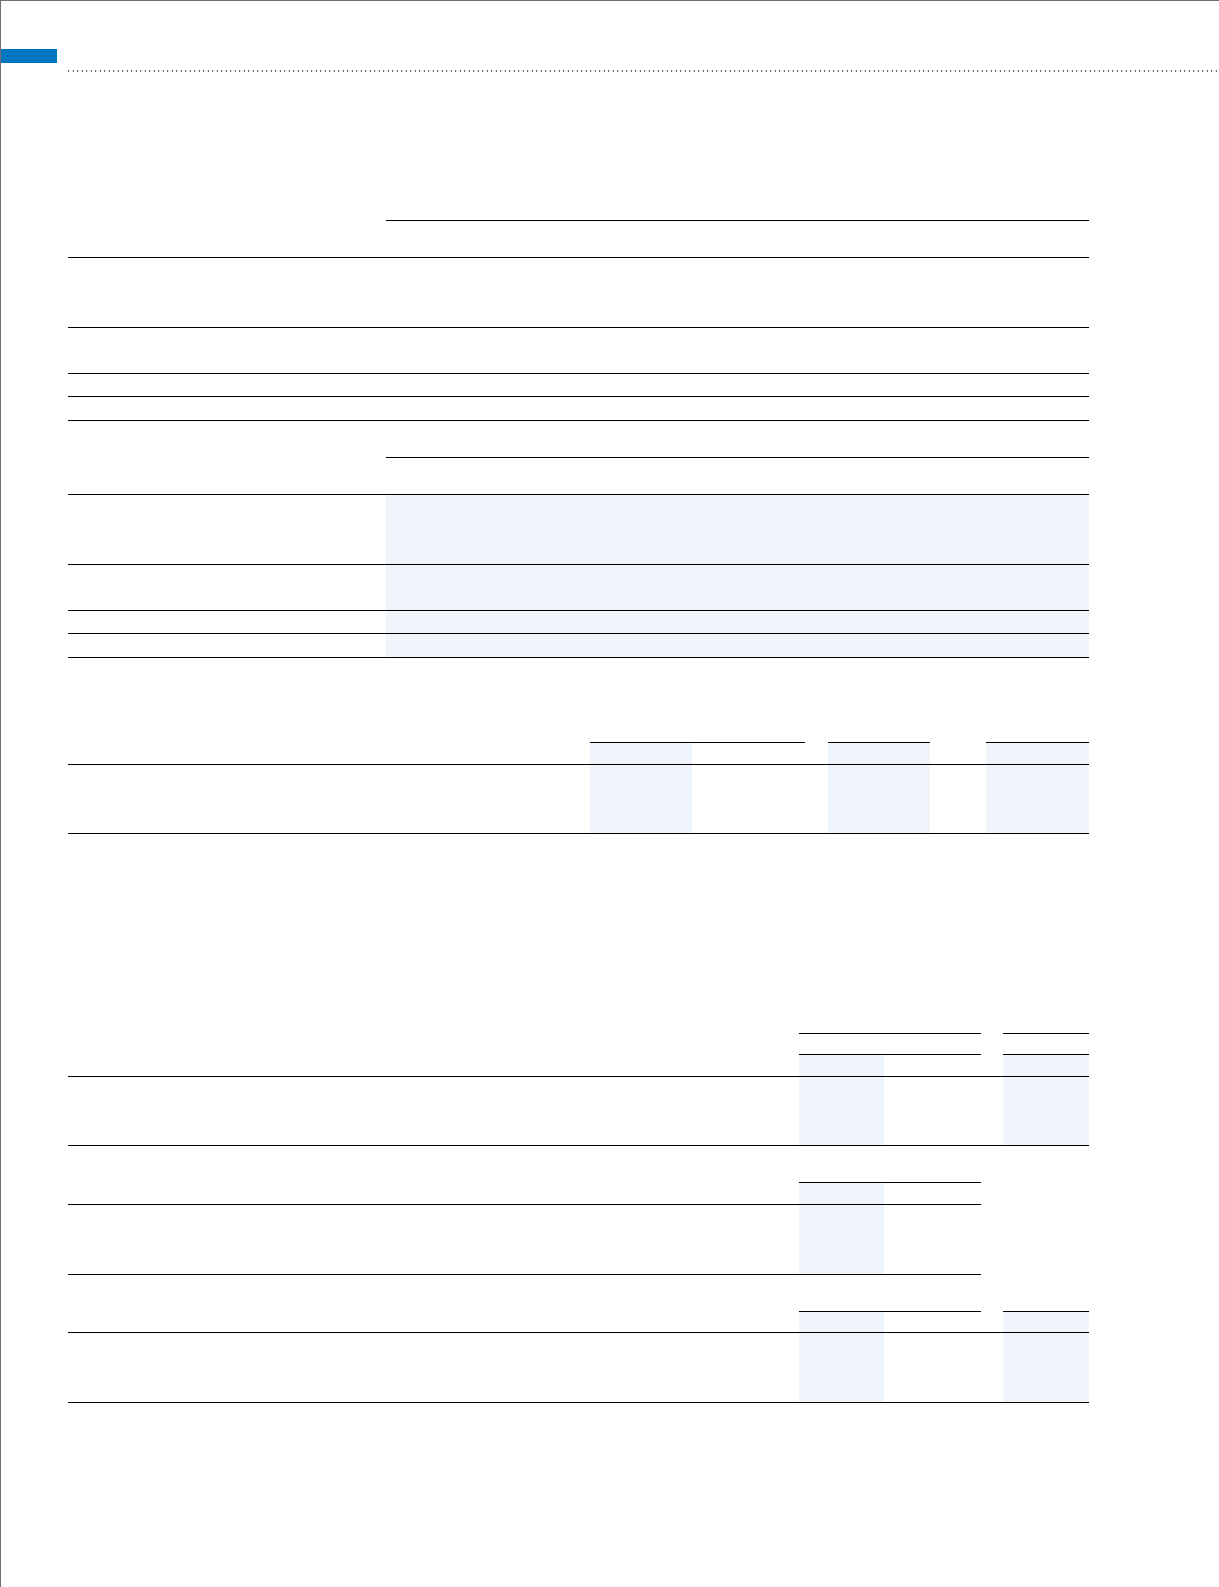
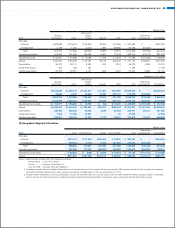
Millions of yen
2009: Japan North America Europe Asia and Other Total
Eliminations
and Corporate Consolidated
Net sales
External ¥437,312 ¥210,565 ¥247,130 ¥ 52,835 ¥ 947,843 ¥ – ¥947,843
Intersegment 280,586 2,632 1,952 191,656 476,827 (476,827) –
Total 717,898 213,197 249,082 244,492 1,424,670 (476,827) 947,843
Operating expenses 662,001 221,571 247,096 238,702 1,369,371 (477,788) 891,583
Operating income (loss) ¥ 55,897 ¥ (8,373) ¥ 1,985 ¥ 5,789 ¥ 55,299 ¥ 961 ¥ 56,260
Assets ¥618,121 ¥123,255 ¥133,427 ¥ 86,430 ¥ 961,235 ¥ (43,176) ¥918,058
Thousands of U.S. dollars
2010: Japan North America Europe Asia and Other Total
Eliminations
and Corporate Consolidated
Net sales
External $4,010,877 $1,848,087 $2,250,054 $ 537,403 $ 8,646,442 $ – $8,646,442
Intersegment 2,317,788 22,732 16,262 1,688,177 4,044,970 (4,044,970) –
Total 6,328,676 1,870,819 2,266,326 2,225,580 12,691,412 (4,044,970) 8,646,442
Operating expenses 5,939,370 1,877,730 2,179,923 2,112,586 12,109,620 (3,935,963) 8,173,656
Operating income (loss) $ 389,295 $ (6,900) $ 86,393 $ 112,994 $ 581,782 $ (108,996) $ 472,786
Assets $6,146,399 $1,076,902 $1,303,482 $1,032,631 $ 9,559,426 $ (253,773) $9,305,643
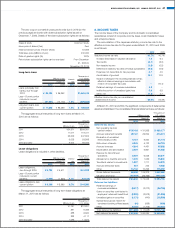
(3) Overseas Sales
Millions of yen
Thousands of
U.S. dollars
Percentage of
net sales
2010 2009 2010 2010
North America ¥174,923 ¥217,024 $1,880,084 21.8%
Europe 233,244 271,797 2,506,922 29.0%
Asia and Other 166,842 202,074 1,793,229 20.7%
Notes:1. Major countries or areas are as follows:
North America .. U.S.A. and Canada
Europe .............. Germany, France and U.K.
Asia and Other . . Australia, China and Singapore
2. “Overseas sales” are the Company and consolidated subsidiary sales in countries or regions outside of Japan.
27. NET INCOME PER SHARE
Calculations of net income per share for the years ended March 31, 2010 and 2009 are as follows:
Millions of yen
Thousands of
U.S. dollars
March 31 March 31
2010 2009 2010
Net income
Income attributable to common shares ¥16,931 ¥15,179 $181,975
Income available to common stockholders 16,884 15,109 181,470
Thousands of shares
2010 2009
Weighted average number of common shares outstanding:
Basic 530,260 530,437
Diluted 556,909 561,462
Yen U.S. dollars
2010 2009 2010
Net income per common share:
Basic ¥31.93 ¥28.62 $0.34
Diluted 30.32 26.91 0.33
50 KONICA MINOLTA HOLDINGS, INC. ANNUAL REPORT 2010