Konica Minolta 2010 Annual Report Download - page 4
Download and view the complete annual report
Please find page 4 of the 2010 Konica Minolta annual report below. You can navigate through the pages in the report by either clicking on the pages listed below, or by using the keyword search tool below to find specific information within the annual report.-
 1
1 -
 2
2 -
 3
3 -
 4
4 -
 5
5 -
 6
6 -
 7
7 -
 8
8 -
 9
9 -
 10
10 -
 11
11 -
 12
12 -
 13
13 -
 14
14 -
 15
15 -
16
-
17
-
18
-
19
-
20
-
21
-
22
-
23
-
24
-
25
-
26
-
27
-
28
-
29
-
30
-
31
-
32
-
33
-
34
-
35
-
36
-
37
-
38
-
39
-
40
-
41
-
42
-
43
-
44
-
45
-
46
-
47
-
48
-
49
-
50
-
51
-
52
-
53
-
54
-
55
-
56
-
57
-
58
 |
 |

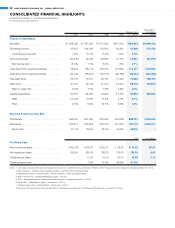
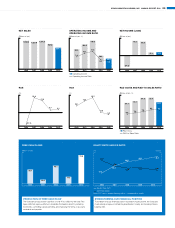
CONSOLIDATED FINANCIAL HIGHLIGHTS
Konica Minolta Holdings, Inc. and Consolidated Subsidiaries
For the fiscal years ended March 31
Millions of yen
Thousands of
U.S. dollars
2006 2007 2008 2009 2010 2010
Results of Operations
Net sales . . . . . . . . . . . . . . . . . . . . . . . . . . . . . . . ¥1,068,390 ¥1,027,630 ¥1,071,568 ¥947,843 ¥804,465 $8,646,442
Operating income . . . . . . . . . . . . . . . . . . . . . . . . . 83,415 104,006 119,606 56,260 43,988 472,786
Operating income ratio . . . . . . . . . . . . . . . . . . . 7.8% 10.1% 11.2% 5.9% 5.5% –
Net income (loss) . . . . . . . . . . . . . . . . . . . . . . . . . (54,305) 72,542 68,829 15,179 16,931 181,975
Net income ratio . . . . . . . . . . . . . . . . . . . . . . . . (5.1)% 7.1% 6.4% 1.6% 2.1% –
Cash flows from operating activities . . . . . . . . . . . 78,924 66,712 123,014 107,563 113,377 1,218,583
Cash flows from investing activities . . . . . . . . . . . . (43,146) (56,401) (76,815) (90,169) (40,457) (434,834)
Free cash flows . . . . . . . . . . . . . . . . . . . . . . . . . . 35,778 10,311 46,198 17,393 72,920 783,749
R&D costs . . . . . . . . . . . . . . . . . . . . . . . . . . . . . . 67,178 72,142 81,370 81,904 68,475 735,974
R&D-to-sales ratio . . . . . . . . . . . . . . . . . . . . . . . 6.3% 7.0% 7.6% 8.6% 8.5% –
Capital expenditure . . . . . . . . . . . . . . . . . . . . . . . . 67,570 64,000 75,295 61,164 36,933 396,958
ROE . . . . . . . . . . . . . . . . . . . . . . . . . . . . . . . . . (17.1)% 21.9% 17.5% 3.7% 4.1% –
ROA . . . . . . . . . . . . . . . . . . . . . . . . . . . . . . . . . 9.0% 11.2% 12.7% 6.2% 5.2% –
Financial Position at Year End
Total assets . . . . . . . . . . . . . . . . . . . . . . . . . . . . . 944,054 951,052 970,538 918,058 865,797 9,305,643
Net assets . . . . . . . . . . . . . . . . . . . . . . . . . . . . . . 293,817 368,624 418,310 414,284 420,775 4,522,517
Equity ratio . . . . . . . . . . . . . . . . . . . . . . . . . . . . 31.1% 38.6% 43.0% 45.0% 48.5% –
Yen U.S. dollars
Per Share Data
Net income per share . . . . . . . . . . . . . . . . . . . . . . ¥(102.29) ¥136.67 ¥129.71 ¥ 28.62 ¥ 31.93 $0.34
Net assets per share . . . . . . . . . . . . . . . . . . . . . . . 553.50 692.39 786.20 779.53 791.28 8.50
Dividends per share . . . . . . . . . . . . . . . . . . . . . . . – 10.00 15.00 20.00 15.00 0.16
Dividend payout ratio . . . . . . . . . . . . . . . . . . . . . . – 7.3% 11.6% 69.9% 47.0% –
Notes: 1. U.S. dollar amounts in this report are translated from yen, for convenience only, at the rate of ¥93.04=US$1, the approximate exchange rate prevailing at March 31, 2010.
2. Free cash flow = Cash flow from operating activities + cash flow from investing activities
3. Shareholders’ equity = Total net assets – minority interests – share subscription rights
4. ROE = Net income ÷ average shareholders’ equity × 100 (%)
5. ROA = (Operating income + interest and dividend income) ÷ average total assets × 100 (%)
6. Equity ratio = Shareholders’ equity ÷ total assets × 100 (%)
7. Dividend payout ratio = Total dividends ÷ net income × 100 (%)
8. Amounts in this annual report are rounded down to the nearest one million yen or the nearest 100 million yen, according to context.
02 KONICA MINOLTA HOLDINGS, INC. ANNUAL REPORT 2010