Konica Minolta 2010 Annual Report Download - page 51
Download and view the complete annual report
Please find page 51 of the 2010 Konica Minolta annual report below. You can navigate through the pages in the report by either clicking on the pages listed below, or by using the keyword search tool below to find specific information within the annual report.-
 1
1 -
2
-
3
-
4
-
5
-
6
-
7
-
8
-
9
-
10
-
11
-
12
-
13
-
14
-
15
-
16
-
17
-
18
-
19
-
20
-
21
-
22
-
23
-
24
-
25
-
26
-
27
-
28
-
29
-
30
-
31
-
32
-
33
-
34
-
35
-
36
-
37
-
38
-
39
-
40
-
 41
41 -
 42
42 -
 43
43 -
 44
44 -
 45
45 -
 46
46 -
 47
47 -
 48
48 -
 49
49 -
 50
50 -
 51
51 -
 52
52 -
 53
53 -
 54
54 -
 55
55 -
 56
56 -
 57
57 -
 58
58
 |
 |

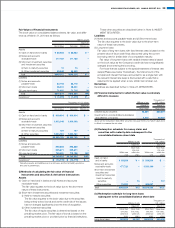
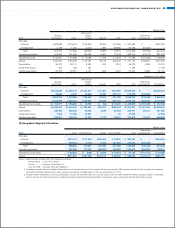
Millions of yen
2009:
Business
Technologies Optics
Medical and
Graphic
Imaging Sensing Other Total
Eliminations
and Corporate Consolidated
Net sales
External ¥623,682 ¥173,416 ¥125,890 ¥8,393 ¥16,459 ¥ 947,843 ¥ – ¥947,843
Intersegment 4,128 1,052 2,419 595 58,860 67,055 (67,055) –
Total 627,810 174,469 128,309 8,989 75,319 1,014,899 (67,055) 947,843
Operating expenses 575,259 161,930 125,226 8,641 72,043 943,100 (51,517) 891,583
Operating income ¥ 52,551 ¥ 12,538 ¥ 3,083 ¥ 348 ¥ 3,276 ¥ 71,798 ¥ (15,538) ¥ 56,260
Assets ¥440,552 ¥156,283 ¥ 89,736 ¥8,125 ¥56,493 ¥ 751,190 ¥166,867 ¥918,058
Depreciation 30,074 28,141 4,335 326 2,341 65,219 4,959 70,179
Impairment losses 150 785 232 – – 1,168 – 1,168
Capital expenditure 23,918 27,591 3,151 306 2,257 57,224 3,939 61,164
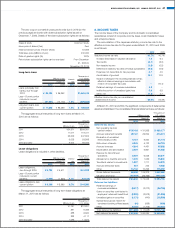
Thousands of U.S. dollars
2010:
Business
Technologies Optics
Medical and
Graphic
Imaging Sensing Other Total
Eliminations
and Corporate Consolidated
Net sales
External $5,812,650 $1,469,744 $1,121,561 $74,387 $168,089 $8,646,442 $ – $8,646,442
Intersegment 39,564 9,931 16,864 10,426 499,710 576,526 (576,526) –
Total 5,852,214 1,479,686 1,138,435 84,824 667,799 9,222,969 (576,526) 8,646,442
Operating expenses 5,433,426 1,325,011 1,122,635 84,899 627,150 8,593,153 (419,497) 8,173,656
Operating income (loss) $ 418,777 $ 154,665 $ 15,789 $ (64) $ 40,638 $ 629,815 $ (157,029) $ 472,786
Assets $4,320,851 $1,494,529 $ 824,033 $80,331 $598,442 $7,318,207 $1,987,425 $9,305,643
Depreciation 332,900 202,053 45,292 3,020 23,485 606,761 50,731 657,502
Impairment losses 1,806 11,285 14,381 – 32 27,526 – 27,526
Capital expenditure 195,507 146,163 19,153 1,773 15,961 378,579 18,379 396,958
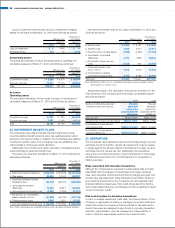
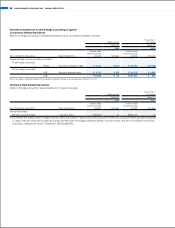
(2) Geographic Segment Information
Millions of yen
2010: Japan North America Europe Asia and Other Total
Eliminations
and Corporate Consolidated
Net sales
External ¥373,172 ¥171,946 ¥209,345 ¥ 50,000 ¥ 804,465 ¥ – ¥804,465
Intersegment 215,647 2,115 1,513 157,068 376,344 (376,344) –
Total 588,820 174,061 210,859 207,068 1,180,809 (376,344) 804,465
Operating expenses 552,599 174,704 202,820 196,555 1,126,679 (366,202) 760,477
Operating income (loss) ¥ 36,220 ¥ (642) ¥ 8,038 ¥ 10,513 ¥ 54,129 ¥ (10,141) ¥ 43,988
Assets ¥571,861 ¥100,195 ¥121,276 ¥ 96,076 ¥ 889,409 ¥ (23,611) ¥865,797
Notes:1. Major countries or areas other than Japan are as follows:
North America .. U.S.A. and Canada
Europe .............. Germany, France and U.K.
Asia and Other . . Australia, China and Singapore
2. Operating expenses that are included in Eliminations and Corporate that can not be properly allocated are primarily R&D expenses incurred by the Company and expenses
associated with head office functions. Such expenses amounted to ¥29,396 million for the year ended March 31, 2010.
3. Included within the Eliminations and Corporate figure of assets are ¥232,694 million of corporate assets, which primarily include the holding company’s surplus of operating
funds (cash and short-term investment securities) and long-term investment funds (investment securities) as well as other assets held by the holding company.
KONICA MINOLTA HOLDINGS, INC. ANNUAL REPORT 2010 49