Konica Minolta 2010 Annual Report Download - page 33
Download and view the complete annual report
Please find page 33 of the 2010 Konica Minolta annual report below. You can navigate through the pages in the report by either clicking on the pages listed below, or by using the keyword search tool below to find specific information within the annual report.-
 1
1 -
2
-
3
-
4
-
5
-
6
-
7
-
8
-
9
-
10
-
11
-
12
-
13
-
14
-
15
-
16
-
17
-
18
-
19
-
20
-
21
-
22
-
 23
23 -
 24
24 -
 25
25 -
 26
26 -
 27
27 -
 28
28 -
 29
29 -
 30
30 -
 31
31 -
 32
32 -
 33
33 -
 34
34 -
 35
35 -
 36
36 -
 37
37 -
 38
38 -
 39
39 -
 40
40 -
 41
41 -
 42
42 -
 43
43 -
44
-
45
-
46
-
47
-
48
-
49
-
50
-
51
-
52
-
53
-
54
-
55
-
56
-
57
-
58
 |
 |

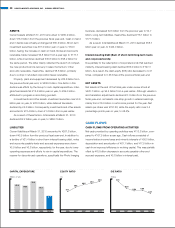
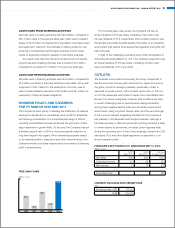
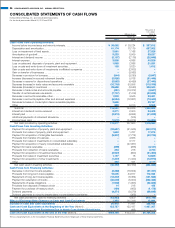
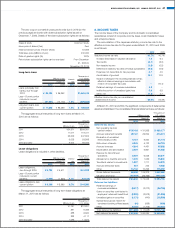
CASH FLOWS FROM INVESTING ACTIVITIES
Net cash used in investing activities was ¥40.4 billion, compared to
¥90.1 billion used in the previous fiscal year. Cash used consisted
largely of ¥33.6 billion for payments for acquisition of property, plant
and equipment, mainly for the purchase of casting molds for new
products in the Business Technologies business and for invest-
ments to augment production capacity in the Optics business.
As a result, free cash flow (the sum of cash flows from operat-
ing activities and investing activities) was a positive ¥72.9 billion,
compared to a positive ¥17.3 billion in the previous fiscal year.
CASH FLOW FROM FINANCING ACTIVITIES
Net cash used in financing activities was ¥43.8 billion, compared to
¥4.9 billion provided by financing activities a year earlier. Along with
a payment of ¥30.0 billion for the redemption of bonds, uses of
cash included dividend payments of ¥9.2 billion and ¥4.4 billion for
repayment of loans and lease obligations.
DIVIDEND POLICY AND DIVIDENDS
FOR FY MARCH 2010 AND 2011
The Company’s basic policy in deciding the distribution of retained
earnings as dividends is to consistently return profits to sharehold-
ers following consideration of a comprehensive range of factors,
including consolidated business results and the promotion of stra-
tegic investment in growth fields. To this end, the Company has set
a dividend payout ratio of 25% or more as a specific medium- to
long-term target in this regard. When deemed appropriate based
on its financial position, share price and other relevant factors, the
Company will also purchase treasury stock as a means of returning
profit to shareholders.
For the fiscal year under review, the Company will pay an
annual dividend of ¥15 per share, consisting of an interim and
full-year dividend of ¥7.5, respectively. The Company opted to pay
this dividend as initially forecast despite the impact of an operating
environment that was far more severe that expected during the first
half of the year.
In light of the challenging operating environment anticipated, in
the fiscal year ending March 31, 2011 the Company expects to pay
an annual dividend of ¥15 per share, consisting of interim and
year-end dividends of ¥7.5 per share.
OUTLOOK
The business environment surrounding the Group is expected to
see the economic recovery gain momentum in Japan and around
the globe. Growth in emerging markets, particularly in Asia, is
expected to remain robust, with a modest upturn also on the hori-
zon for the developed economies of Japan, the United States and
Europe. The Group recognizes, however, that conditions are likely
to remain challenging due to several issues fueling uncertainty,
among them negative factors such as a worsening employment
environment, rising long-term interest rates, and the yen’s strength
in the currency markets. Regarding forecasts for the Company’s
key markets, in the Business Technologies business, although a
full-scale recovery in office and production printing products is likely
to remain elusive for some time, a modest upturn appears likely
during the upcoming term. In the Optics business, demand for LCD
televisions, PCs and other digital appliances is expected to con-
tinue to expand overall.
FORECASTS FOR FY MARCH 2011 (ANNOUNCED MAY 13, 2010)
(Billions of yen)
1H FY
March 2011
2H FY
March 2011
Full Year
FY March 2011
Net Sales 400 430 830
Operating Income 21 29 50
Net Income 8 12 20
Free Cash Flow 20
CURRENCY EXCHANGE RATE ASSUMPTIONS
(Yen)
Exchange rate USD 90.00
EUR 120.00
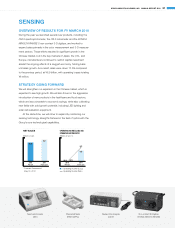
2006
35.7
2007
10.3
2008
46.1
2009
17.3
2010
72.9
FREE CASH FLOWS
(Billions of yen)
KONICA MINOLTA HOLDINGS, INC. ANNUAL REPORT 2010 31