Konica Minolta 2010 Annual Report Download - page 32
Download and view the complete annual report
Please find page 32 of the 2010 Konica Minolta annual report below. You can navigate through the pages in the report by either clicking on the pages listed below, or by using the keyword search tool below to find specific information within the annual report.-
 1
1 -
2
-
3
-
4
-
5
-
6
-
7
-
8
-
9
-
10
-
11
-
12
-
13
-
14
-
15
-
16
-
17
-
18
-
19
-
20
-
21
-
 22
22 -
 23
23 -
 24
24 -
 25
25 -
 26
26 -
 27
27 -
 28
28 -
 29
29 -
 30
30 -
 31
31 -
 32
32 -
 33
33 -
 34
34 -
 35
35 -
 36
36 -
 37
37 -
 38
38 -
 39
39 -
 40
40 -
 41
41 -
 42
42 -
43
-
44
-
45
-
46
-
47
-
48
-
49
-
50
-
51
-
52
-
53
-
54
-
55
-
56
-
57
-
58
 |
 |

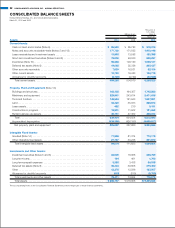
ASSETS
Current assets at March 31, 2010 amounted to ¥489.2 billion,
down ¥15.6 billion from the previous fiscal year-end. Cash on hand
and in banks was virtually unchanged at ¥85.5 billion. Short-term
investment securities rose ¥31.0 billion year on year, to ¥79.0
billion, fueling the increase in cash on hand. Notes and accounts
receivable-trade increased ¥5.8 billion from a year ago to ¥177.7
billion, while inventories declined ¥30.8 billion to ¥98.2 billion for
the same period. The latter mainly reflected the launch of competi-
tive new products and a recovery in sales momentum. Other
accounts receivable, meanwhile, declined ¥8.8 billion, primarily
due to a drop in refunded corporation taxes receivable.
Property, plant and equipment decreased by ¥22.8 billion from
the previous fiscal year-end, to ¥205.0 billion. One factor in this
decline was efforts by the Group to curb capital expenditure. Intan-
gible fixed assets fell ¥12.5 billion year on year, to ¥99.0 billion,
attributed to progress in amortizing goodwill.
In investments and other assets, investment securities rose ¥3.9
billion year on year, to ¥22.0 billion, while deferred tax assets
declined by ¥4.3 billion. Consequently, investments and other assets
amounted to ¥72.4 billion, down ¥1.2 billion from a year earlier.
As a result of these factors, total assets at March 31, 2010
declined ¥52.2 billion year on year, to ¥865.7 billion.
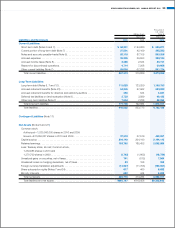
LIABILITIES
Current liabilities at March 31, 2010 amounted to ¥267.3 billion,
down ¥43.5 billion from the previous fiscal year-end. In addition to
a decline of ¥21.4 billion in short-term interest-bearing debt, notes
and accounts payable-trade and accrued expenses were down
¥3.9 billion and ¥3.3 billion, respectively, for the year, due to lower
operating expenses and efforts to rein in capital expenditure. The
reserve for discontinued operations, specifically the Photo Imaging
business, decreased ¥2.5 billion from the previous year to ¥4.7
billion. Long-term liabilities, meanwhile, declined ¥15.1 billion to
¥177.7 billion.
As a result, total liabilities at March 31, 2010 declined ¥58.7
billion year on year, to ¥445.0 billion.
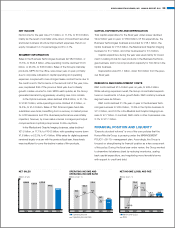
Interest-bearing Debt (Sum of short-term/long-term loans
and corporate bonds)
Due partially to the redemption of corporate bonds that reached
maturity, interest-bearing debt declined ¥33.0 billion to ¥197.3
billion. As a result, the debt-equity (D/E) ratio decreased to 0.47
times, compared to 0.56 times at the previous fiscal year-end.
NET ASSETS
Net assets at the end of the fiscal year under review stood at
¥420.7 billion, up ¥6.4 billion from a year earlier. Although valuation
and translation adjustments declined ¥2.1 billion from the previous
fiscal year-end, net assets rose atop growth in retained earnings,
mainly from ¥16.9 billion in net income posted for the year. Net
assets per share was ¥791.28, while the equity ratio rose 3.4
percentage points year on year, to 48.5%.
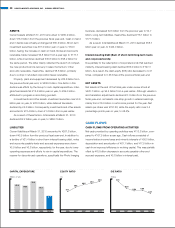
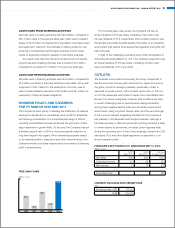
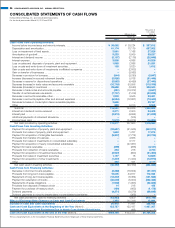
CASH FLOWS
CASH FLOWS FROM OPERATING ACTIVITIES
Net cash provided by operating activities was ¥113.3 billion, com-
pared to ¥107.5 billion a year ago. Cash inflows consisted of
income before income taxes and minority interests of ¥36.0 billion,
depreciation and amortization of ¥61.1 billion, and ¥17.5 billion in
cash from improved efficiency in working capital. This was partially
offset by ¥6.5 billion decrease in accounts payable-other and
accrued expenses, and ¥3.8 billion in interest paid.
2006
67.5
2007
64.0
2008
75.2
2009
61.1
2010
36.9
2006
31.1
38.6
43.0 45.0
48.5
2007 2008 2009 2010
2006
0.81
0.62
0.54 0.56
0.47
2007 2008 2009 2010
CAPITAL EXPENDITURE EQUITY RATIO D/E RATIO
(Billions of yen) (%) (Times)
30 KONICA MINOLTA HOLDINGS, INC. ANNUAL REPORT 2010