Konica Minolta 2010 Annual Report Download - page 50
Download and view the complete annual report
Please find page 50 of the 2010 Konica Minolta annual report below. You can navigate through the pages in the report by either clicking on the pages listed below, or by using the keyword search tool below to find specific information within the annual report.-
 1
1 -
2
-
3
-
4
-
5
-
6
-
7
-
8
-
9
-
10
-
11
-
12
-
13
-
14
-
15
-
16
-
17
-
18
-
19
-
20
-
21
-
22
-
23
-
24
-
25
-
26
-
27
-
28
-
29
-
30
-
31
-
32
-
33
-
34
-
35
-
36
-
37
-
38
-
39
-
 40
40 -
 41
41 -
 42
42 -
 43
43 -
 44
44 -
 45
45 -
 46
46 -
 47
47 -
 48
48 -
 49
49 -
 50
50 -
 51
51 -
 52
52 -
 53
53 -
 54
54 -
 55
55 -
 56
56 -
 57
57 -
 58
58
 |
 |

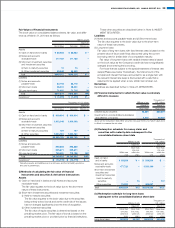
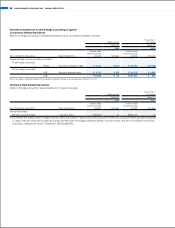
25. INVESTMENT AND RENTAL PROPERTY
Additional Information
Effective from the year ended March 31, 2010, the Companies adopted
ASBJ Statement No. 20, “Accounting Standards for Disclosures about
Fair Value of Investment and Rental Property”, issued by the ASBJ on
November 28, 2008 and ASBJ Guidance No. 23, “Guidance on
Accounting Standards for Disclosures about Fair Value of Investment
and Rental Property”, issued by the ASBJ on November 28, 2008.
Conditions and Fair Value of Investment and Rental Property
The Companies have office buildings for rent and idle assets, etc., in
Japan and overseas.
The book value on the consolidated balance sheet, the changes and
the fair value as of March 31, 2010 are as follows:
Millions of yen
Book Value Fair Value
as of March
31, 2009
Increase
(Decrease)
—net
as of March
31, 2010
as of March
31, 2010
Investment and
rental property ¥3,973 ¥ (117) ¥3,855 ¥4,800
Thousands of U.S. dollars
Investment and
rental property $42,702 $(1,258) $41,434 $51,591
Notes:1. Book value is calculated by subtracting accumulated depreciation and
accumulated impairment losses from acquisition cost.
2. Fair value as of March 31, 2010 is recorded as follows:
(1) Fair value of a majority of domestic properties has been calculated by the
Companies in accordance with the method similar to the Real-estate
Appraisal Standards. When there is no significant change in fair value, the
properties are valued using the most recent appraisal report.
Fair value of other properties has been calculated based on a certain
appraisal or criteria which appear to best reflect the fair value of the property.
(2) Fair value of overseas properties has been primarily calculated by local
real-estate appraisers.
Income and Expenses of Investment and Rental Property
The income and expenses as of March 31, 2010 are as follows.
Millions of yen
Thousands of
U.S. dollars
March 31 March 31
2010 2010
Income of investment and rental property ¥208 $2,236
Expenses of investment and rental property 257 2,762
Difference (48) (516)
Other income (expenses) of investment
and rental property – –
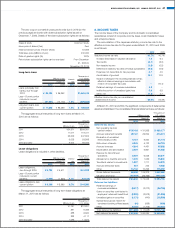
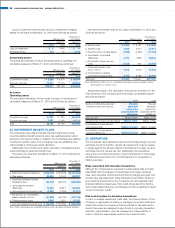
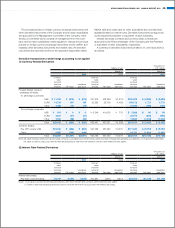
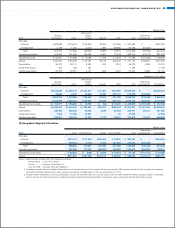
26. SEGMENT INFORMATION
(1) Business Segment Information
Business segment information of the Companies for the years ended March 31, 2010 and 2009 is presented as follows:
Business segment Related business segment products
Business Technologies: MFPs, printers and others
Optics: Optical devices, electronics materials and others
Medical and Graphic Imaging: Medical products, graphic imaging products and others
Sensing: Industrial-use and medical-use measuring instruments and others
Other: Other products not categorized in the above segments
Millions of yen
2010:
Business
Technologies Optics
Medical and
Graphic
Imaging Sensing Other Total
Eliminations
and Corporate Consolidated
Net sales
External ¥540,809 ¥136,745 ¥104,350 ¥6,921 ¥15,639 ¥804,465 ¥ – ¥804,465
Intersegment 3,681 924 1,569 970 46,493 53,640 (53,640) –
Total 544,490 137,670 105,920 7,892 62,132 858,105 (53,640) 804,465
Operating expenses 505,526 123,279 104,450 7,899 58,350 799,507 (39,030) 760,477
Operating income (loss) ¥ 38,963 ¥ 14,390 ¥ 1,469 ¥ (6) ¥ 3,781 ¥ 58,598 ¥ (14,610) ¥ 43,988
Assets ¥402,012 ¥139,051 ¥ 76,668 ¥7,474 ¥55,679 ¥680,886 ¥184,910 ¥865,797
Depreciation 30,973 18,799 4,214 281 2,185 56,453 4,720 61,174
Impairment losses 168 1,050 1,338 – 3 2,561 – 2,561
Capital expenditure 18,190 13,599 1,782 165 1,485 35,223 1,710 36,933
Notes: 1. Operating expenses that are included in Eliminations and Corporate that can not be properly allocated are primarily R&D expenses incurred by the Company and expenses
associated with head office functions. Such expenses amounted to ¥29,396 million for the year ended March 31, 2010.
2. Included within the Eliminations and Corporate figure of assets are ¥232,694 million of corporate assets, which primarily include the holding company’s surplus of operating
funds (cash and short-term investment securities) and long-term investment funds (investment securities) as well as other assets held by the holding company.
48 KONICA MINOLTA HOLDINGS, INC. ANNUAL REPORT 2010