Konica Minolta 2010 Annual Report Download - page 6
Download and view the complete annual report
Please find page 6 of the 2010 Konica Minolta annual report below. You can navigate through the pages in the report by either clicking on the pages listed below, or by using the keyword search tool below to find specific information within the annual report.-
 1
1 -
 2
2 -
 3
3 -
 4
4 -
 5
5 -
 6
6 -
 7
7 -
 8
8 -
 9
9 -
 10
10 -
 11
11 -
 12
12 -
 13
13 -
 14
14 -
 15
15 -
 16
16 -
 17
17 -
18
-
19
-
20
-
21
-
22
-
23
-
24
-
25
-
26
-
27
-
28
-
29
-
30
-
31
-
32
-
33
-
34
-
35
-
36
-
37
-
38
-
39
-
40
-
41
-
42
-
43
-
44
-
45
-
46
-
47
-
48
-
49
-
50
-
51
-
52
-
53
-
54
-
55
-
56
-
57
-
58
 |
 |
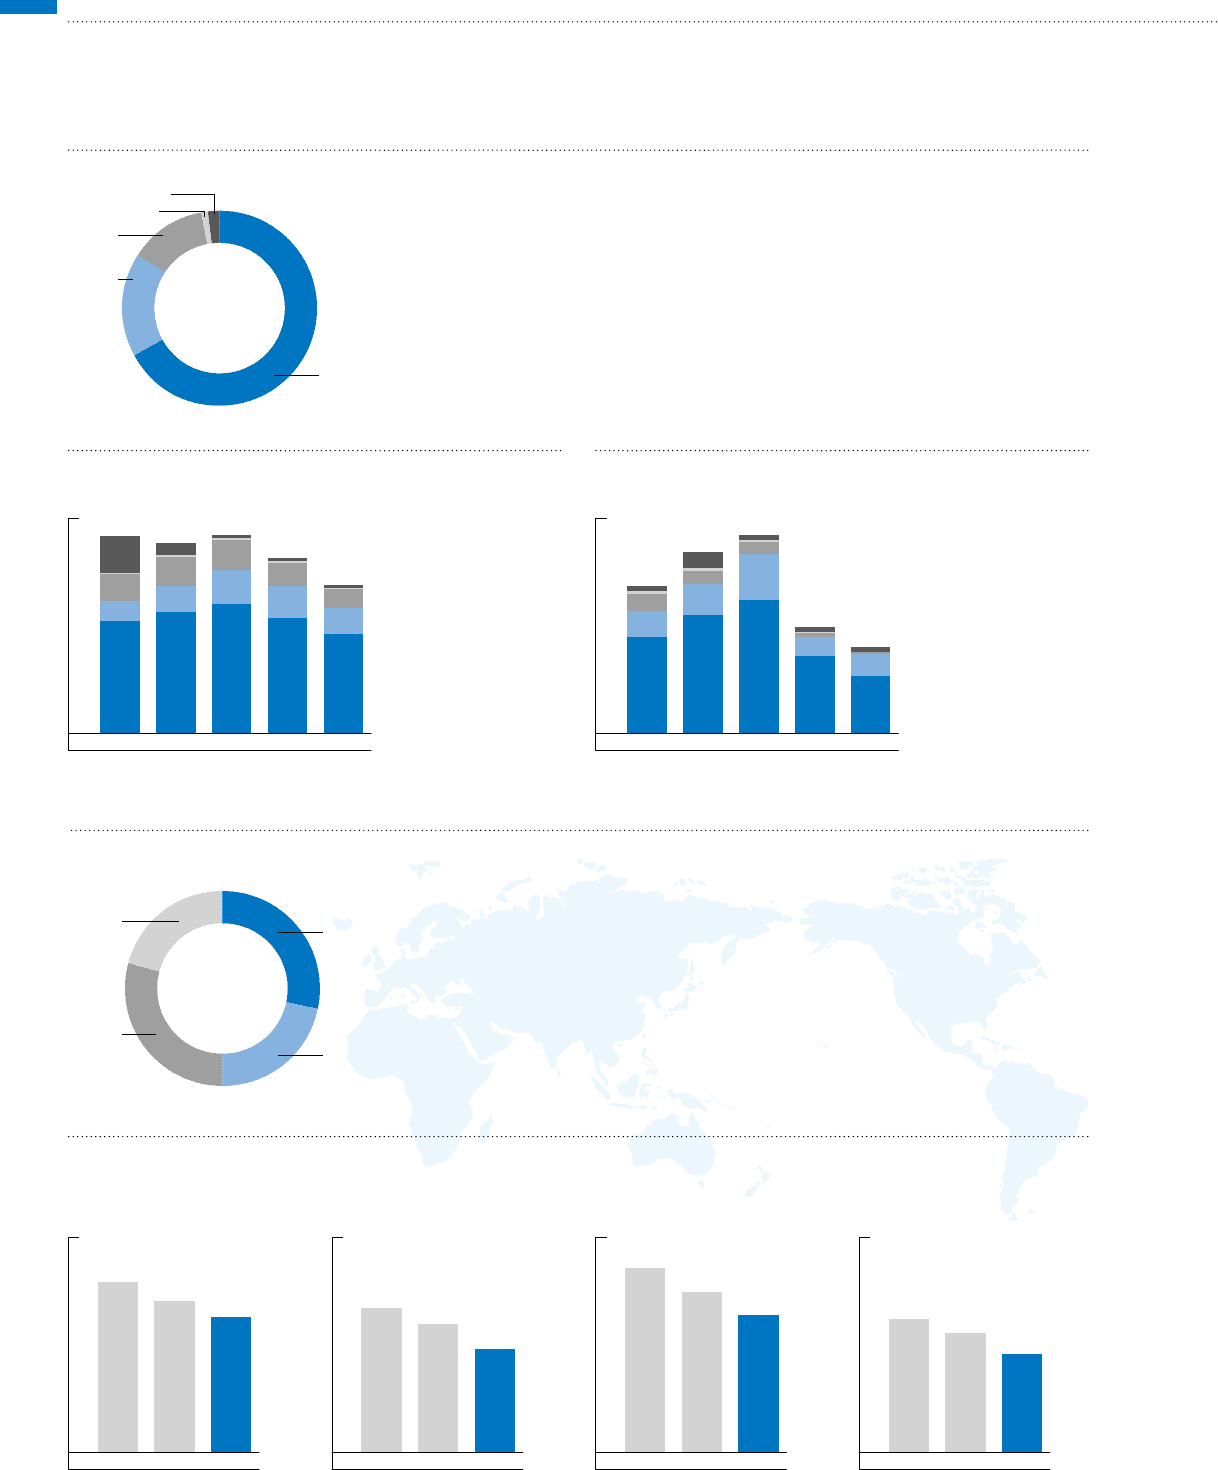
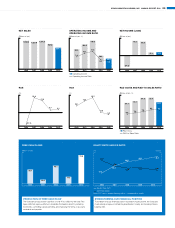
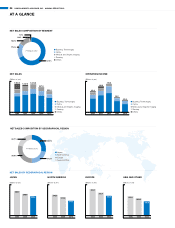
AT A GLANCE
2008
288.7
256.9
229.4
2009 2010
JAPAN
(Billions of yen)
2008
245.4
217.0
174.9
2009 2010
NORTH AMERICA
(Billions of yen)
2008
312.1
271.7
233.2
2009 2010
EUROPE
(Billions of yen)
2008
225.1
202.0
166.8
2009 2010
ASIA AND OTHER
(Billions of yen)
NET SALES BY GEOGRAPHICAL REGION
2006 2007 2008 2009 2010
1,068.3 1,027.6 1,071.5
947.8
804.4
NET SALES
(Billions of yen)
n Business Technologies
n Optics
n Medical and Graphic Imaging
n Sensing
n Others
2006 2007 2008 2009 2010
83.4
104.0
119.6
56.2
43.9
OPERATING INCOME
(Billions of yen)
n Business Technologies
n Optics
n Medical and Graphic Imaging
n Sensing
n Others
NET SALES COMPOSITION BY GEOGRAPHICAL REGION
FY March 2010
n Japan
n North America
n Europe
n Asia and Other
28.5%
21.8%
29.0%
20.7%
NET SALES COMPOSITION BY SEGMENT
FY March 2010 n Business Technologies
n Optics
n Medical and Graphic Imaging
n Sensing
n Others
67.2%
13.0%
0.9%
1.9%
17.0%
04 KONICA MINOLTA HOLDINGS, INC. ANNUAL REPORT 2010