Konica Minolta 2010 Annual Report Download - page 31
Download and view the complete annual report
Please find page 31 of the 2010 Konica Minolta annual report below. You can navigate through the pages in the report by either clicking on the pages listed below, or by using the keyword search tool below to find specific information within the annual report.-
 1
1 -
2
-
3
-
4
-
5
-
6
-
7
-
8
-
9
-
10
-
11
-
12
-
13
-
14
-
15
-
16
-
17
-
18
-
19
-
20
-
 21
21 -
 22
22 -
 23
23 -
 24
24 -
 25
25 -
 26
26 -
 27
27 -
 28
28 -
 29
29 -
 30
30 -
 31
31 -
 32
32 -
 33
33 -
 34
34 -
 35
35 -
 36
36 -
 37
37 -
 38
38 -
 39
39 -
 40
40 -
 41
41 -
42
-
43
-
44
-
45
-
46
-
47
-
48
-
49
-
50
-
51
-
52
-
53
-
54
-
55
-
56
-
57
-
58
 |
 |

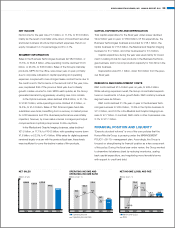
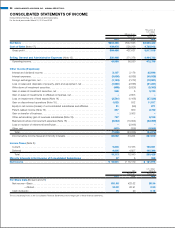
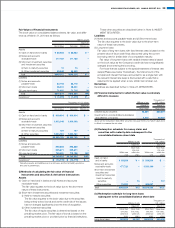
NET INCOME
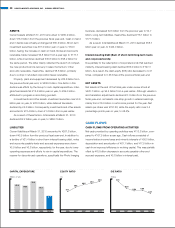
Net income for the year rose ¥1.7 billion, or 11.5%, to ¥16.9 billion,
mainly as the result of a smaller write-down of investment securities
and lower business structure improvement expenses. Return on
equity increased 0.4 of a percentage point to 4.1%.
SEGMENT INFORMATION
Sales in the Business Technologies business fell ¥82.8 billion, or
13.3%, to ¥540.8 billion, while operating income declined ¥13.5
billion, or 25.9%, to ¥38.9 billion. Sales of the Group’s mainstay
products, MFPs for the office, were lower year on year, primarily
due to corporate cutbacks in capital spending and operating
expenses, coupled with more stringent lease contract terms due to
the credit crunch. Performance in the second half of the year, how-
ever, surpassed that of the previous fiscal year due to steady
growth in sales volume for color MFPs each quarter, as the Group
generated demand by aggressively unveiling new color models.
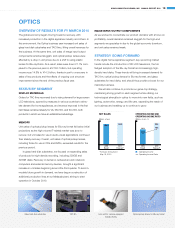
In the Optics business, sales declined ¥36.6 billion, or 21.1%,
to ¥136.7 billion, while operating income climbed ¥1.8 billion, or
14.8%, to ¥14.3 billion. Sales of TAC films and glass hard disk
substrates were brisk, benefitting from a recovery in market prices
for LCD televisions and PCs. Business performance was notably
impacted, however, by lower sales volumes in image input/output
components and optical pickup lenses for Blu-ray Discs.
In the Medical and Graphic Imaging business, sales declined
¥21.5 billion, or 17.1%, to ¥104.3 billion, with operating income down
¥1.6 billion, or 52.3%, to ¥1.4 billion. While sales for digital equipment
remained largely on a par with the previous fiscal year, these levels
were insufficient to cover the decline in sales of film products.
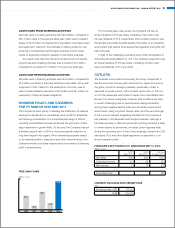
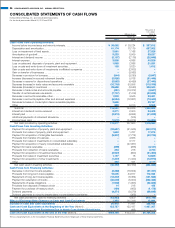
CAPITAL EXPENDITURE AND DEPRECIATION
Total capital expenditure for the fiscal year under review declined
¥24.2 billion year on year, to ¥36.9 billion. Of this expenditure, the
Business Technologies business accounted for ¥18.1 billion, the
Optics business for ¥13.5 billion, the Medical and Graphic Imaging
business for ¥1.7 billion, and other businesses for ¥3.3 billion.
Capital expenditure during the year was used mainly for invest-
ment in casting molds for new products in the Business Technolo-
gies business, and to boost production capacity for TAC films in the
Optics business.
Depreciation was ¥61.1 billion, down ¥9.0 billion from the previ-
ous fiscal year.
RESEARCH AND DEVELOPMENT COSTS
R&D costs declined ¥13.4 billion year on year, to ¥68.4 billion.
While reducing expenses overall, the Group concentrated expendi-
tures on investments in future growth fields. R&D costs by business
segment were as follows.
R&D costs declined 21.3% year on year in the Business Tech-
nologies business to ¥38.4 billion, 13.6% in the Optics business to
¥11.0 billion, and 16.0% in the Medical and Graphic Imaging busi-
ness to ¥7.7 billion. In contrast, R&D costs in other businesses rose
2.1% to ¥11.1 billion.
FINANCIAL POSITION AND LIQUIDITY
“Execute structural reforms” is one of the core policies that the
Konica Minolta Group is pursuing under the MANAGEMENT
POLICY <09-10> management plan. Accordingly, the Group is
focused on strengthening its financial position as a key component
of this policy. During the fiscal year under review, the Group worked
to streamline its balance sheet by reducing inventories, scaling
back capital expenditure, and negotiating more favorable terms
with respect to credit and debt.
2006
1,068.3
2007
1,027.6
2008
1,071.5
2009
947.8
2010
804.4
2006
83.4
2007
104.0
2008
119.6
2009
56.2
2010
43.9
7.8
10.1 11.2
5.9 5.5
2006
(54.3)
2007
72.5
2008
68.8
2009
15.1
2010
16.9
(17.1)
21.9
17.5
3.7 4.1
NET SALES OPERATING INCOME AND
OPERATING INCOME RATIO
NET INCOME (LOSS) AND ROE
(Billions of yen) (Billions of yen, %) (Billions of yen, %)
nn Operating Income
n
Operating Income Ratio
nn Net Income (Loss)
n
ROE
KONICA MINOLTA HOLDINGS, INC. ANNUAL REPORT 2010 29