Kia 2004 Annual Report Download - page 87
Download and view the complete annual report
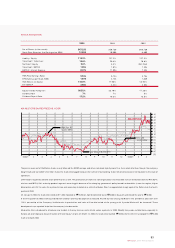
Please find page 87 of the 2004 Kia annual report below. You can navigate through the pages in the report by either clicking on the pages listed below, or by using the keyword search tool below to find specific information within the annual report.-
 1
1 -
2
-
3
-
4
-
5
-
6
-
7
-
8
-
9
-
10
-
11
-
12
-
13
-
14
-
15
-
16
-
17
-
18
-
19
-
20
-
21
-
22
-
23
-
24
-
25
-
26
-
27
-
28
-
29
-
30
-
31
-
32
-
33
-
34
-
35
-
36
-
37
-
38
-
39
-
40
-
41
-
42
-
43
-
44
-
45
-
46
-
47
-
48
-
49
-
50
-
51
-
52
-
53
-
54
-
55
-
56
-
57
-
58
-
59
-
60
-
61
-
62
-
63
-
64
-
65
-
66
-
67
-
68
-
69
-
70
-
71
-
72
-
73
-
74
-
75
-
76
-
 77
77 -
 78
78 -
 79
79 -
 80
80 -
 81
81 -
 82
82 -
 83
83 -
 84
84 -
 85
85 -
 86
86 -
 87
87 -
 88
88 -
 89
89 -
 90
90 -
 91
91 -
 92
92 -
 93
93 -
 94
94 -
 95
95 -
 96
96 -
 97
97 -
98
-
99
-
100
 |
 |
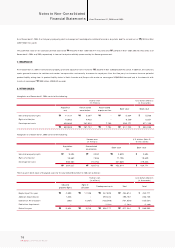
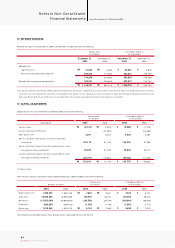
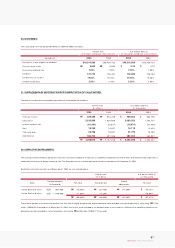
20. DIVIDENDS:
The computation of the proposed dividends in 2004 and 2003 is as follows:
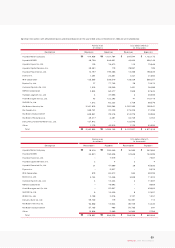
21. SUPPLEMENTARY INFORMATION FOR COMPUTATION OF VALUE ADDED:
The accounts and amounts needed for calculation of value added are as follows:
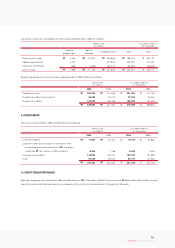
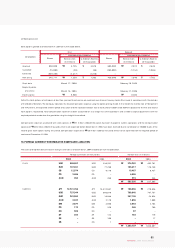
22. DERIVATIVE INSTRUMENTS:
The Company had entered into derivative instrument contracts to hedge the exposure to variability in expected future cash flow s of forecasted export sales that is
attributable to changes in foreign exchange rate. The Com pany has no unsettled derivative instrum ent contracts as of December 31, 2004.
Derivative instrument contracts as of December 31, 2003 are summarized below.
The effective portion of the derivative contracts for cash flow hedging purpose from forecasted export sales recorded as a capital adjustm ent, amounting ₩41,599
million (US$39,853 thousand) as of December 31, 2003, all of which were included in the determination of net incom e in 2004 and the ineffective portion of the
derivative contracts recorded in current operations, amounting ₩48,820 million (US$46,771 thousand).
87
KIA Motors_2004 Annual Report
346,210,586
5,000
7.00%
121,174
17.50%
3.20%
₩
2004Description 2003 2004 2003
358,420,732
5,000
7.00%
125,447
16.30%
3.40%
₩
346,210,586
4.79
7.00%
116,089
17.50%
3.20%
$
358,420,732
4.79
7.00%
120,184
16.30%
3.40%
$
Num ber of shares eligible for dividend
Face value per share
Face value dividend rate
Dividend
Dividend to net income
Dividend yield ratio
Korean won
(in millions, except per share amount) U.S. dollars (Note 2)
(in thousands, except per share amount)
829,469
2,150,595
(16,361)
15,780
22,729
396,700
3,398,912
₩
₩
2004 2003 2004 2003
944,429
1,839,928
(32,837)
14,021
19,521
401,958
3,187,020
₩
₩
794,663
2,060,352
(15,674)
15,118
21,775
380,054
3,256,288
$
$
904,799
1,762,721
(31,459)
13,433
18,702
385,091
3,053,287
$
$
Ordinary income
Labor costs
Interest expense, net
Rent
Taxes and dues
Depreciation
Korean won
(in millions) U.S. dollars (Note 2)
(in thousands)
907,000
1,440,000
EUR
USD
(41,599)
–
(41,599)
₩
₩
(31,426)
(17,394)
(48,820)
₩
₩
(79,486)
(17,394)
(96,880)
₩
₩
(76,151)
(16,664)
(92,815)
$
$
Bank Contract amounts
(in thousand) Fair value Valuation loss Capital
adjustments Fair value
Koram Bank and other
Koram Bank and other
Korean won
(in millions) U.S. dollars (Note 2)
(in thousands)