Kia 2004 Annual Report Download - page 53
Download and view the complete annual report
Please find page 53 of the 2004 Kia annual report below. You can navigate through the pages in the report by either clicking on the pages listed below, or by using the keyword search tool below to find specific information within the annual report.-
 1
1 -
2
-
3
-
4
-
5
-
6
-
7
-
8
-
9
-
10
-
11
-
12
-
13
-
14
-
15
-
16
-
17
-
18
-
19
-
20
-
21
-
22
-
23
-
24
-
25
-
26
-
27
-
28
-
29
-
30
-
31
-
32
-
33
-
34
-
35
-
36
-
37
-
38
-
39
-
40
-
41
-
42
-
 43
43 -
 44
44 -
 45
45 -
 46
46 -
 47
47 -
 48
48 -
 49
49 -
 50
50 -
 51
51 -
 52
52 -
 53
53 -
 54
54 -
 55
55 -
 56
56 -
 57
57 -
 58
58 -
 59
59 -
 60
60 -
 61
61 -
 62
62 -
 63
63 -
64
-
65
-
66
-
67
-
68
-
69
-
70
-
71
-
72
-
73
-
74
-
75
-
76
-
77
-
78
-
79
-
80
-
81
-
82
-
83
-
84
-
85
-
86
-
87
-
88
-
89
-
90
-
91
-
92
-
93
-
94
-
95
-
96
-
97
-
98
-
99
-
100
 |
 |

53
KIA Motors_2004 Annual Report
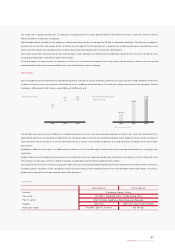
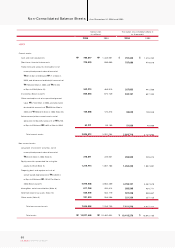
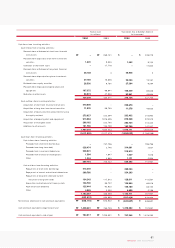
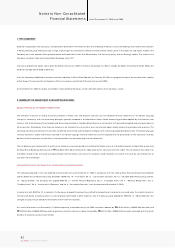
Trade receivables were down ₩155.7 billion year on year. The protracted slump in domestic market led to fewer issuances of domestic trade receivables and the
com pany liquidated more of its export trade receivables as soon as possible. Inventories increased ₩193.9 billion from the previous year as a result of a rise in
dom estic inventory of built-up cars.
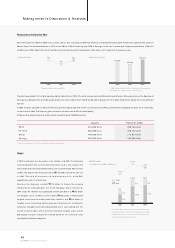
Fixed Assets
The investment assets in fixed assets increased ₩245.2 billion year on year. During the sam e period, long-term investm ent securities and securities under equity
method grew ₩307.3 billion. The gain was due to the following factors:
The Company acquired stocks of its affiliates and overseas subsidiaries to ensure smooth parts supply and boost exports. There were equity-method gains on stocks
of Hyundai Mobis, Wia and Hyundai Hysco. Share prices for marketable securities such as INI Steel also rose on the stock market.
Tangible assets climbed ₩311.6 billion year on year, mainly driven by increased new investm ent in new model development and engine and transmission
production facilities. At the same time, intangible assets also increased ₩157.4 billion because R&D expenses related to new versions of the Rio, Carnival (Sedona),
Optima (Magentis) and Carens were capitalized.
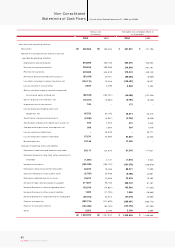
Current Liabilities
Trade accounts payable in 2004 grew ₩311.6 billion from the previous year, boosted by increases in material and component purchases due to expanded
production of built-up cars. At the sam e time, short-term borrowings shrank ₩418.6 billion because increased exports provided more cash, and subsequently
com pany issued ₩300 billion less commercial paper than in 2003 and repaid matured foreign currency borrowings, ₩79.6 billion. In addition, the current portion
of debentures and current portion of long-term debt decreased ₩224.4 billion as they were repaid as matured borrowings.
Long-term Liabilities
A total amount of debentures declined ₩200 million from the previous year. Although the com pany issued additional US$200 million (₩229.4 billion) in corporate
bonds, the dollar-denominated bonds produced ₩73 billion in gains on foreign exchange evaluation and were reclassified on the books as current debentures
and current long-term debts within one year of maturity. The surge in overseas sales volum e was expected to boost overall warranty provision (including both short
and long term) significantly with the growing number of vehicles under warranty and expansion in recall provision. However, strong sales of vehicles with improved
quality and the sharp fall in foreign exchange rate nudged the provision up to ₩815.2 billion.
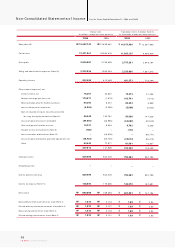
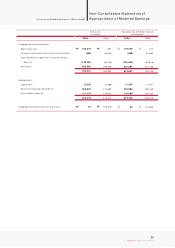
Shareholders' Equity
The stock option rights granted in 2000 were exercised to generate a ₩1 billion gain on the disposition of treasury stock, causing capital surplus to rise from the
previous year. Net income of ₩690.6 billion was generated in 2004, but 2003 dividend payout of ₩125.4 billion was followed by ₩136.7 billion share buyback and
cancellation in 2004 and other expenses. As a result, retained earnings increased ₩427.5 billion year on year. Meanwhile, total capital adjustm ent was increased by
₩57.5 billion from the previous year. The adjustments are as follow s: Profit on paper (valuation incom e) increased ₩49 billion from the previous year as a result of
higher prices for listed stocks held by the Company. On the other hand, the net loss on equity evaluation method rose ₩34.3 billion from the previous year, while
the (-)₩41.6 billion that was held for capital adjustm ent of short-term derivative investment incurred in 2003 was invalidated in 2004.
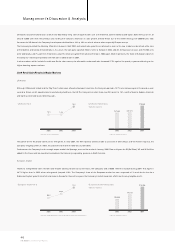
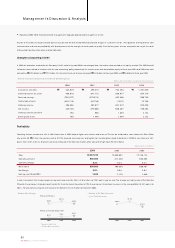
• Debt-to-Equity Ratio • Equity-to-Asset Ratio
2002
127.3%
2003
127.2%
2004
113.2%
2002
44.0%
2003
44.0%
2004
46.9%