Kia 2004 Annual Report Download - page 50
Download and view the complete annual report
Please find page 50 of the 2004 Kia annual report below. You can navigate through the pages in the report by either clicking on the pages listed below, or by using the keyword search tool below to find specific information within the annual report.-
 1
1 -
2
-
3
-
4
-
5
-
6
-
7
-
8
-
9
-
10
-
11
-
12
-
13
-
14
-
15
-
16
-
17
-
18
-
19
-
20
-
21
-
22
-
23
-
24
-
25
-
26
-
27
-
28
-
29
-
30
-
31
-
32
-
33
-
34
-
35
-
36
-
37
-
38
-
39
-
 40
40 -
 41
41 -
 42
42 -
 43
43 -
 44
44 -
 45
45 -
 46
46 -
 47
47 -
 48
48 -
 49
49 -
 50
50 -
 51
51 -
 52
52 -
 53
53 -
 54
54 -
 55
55 -
 56
56 -
 57
57 -
 58
58 -
 59
59 -
 60
60 -
61
-
62
-
63
-
64
-
65
-
66
-
67
-
68
-
69
-
70
-
71
-
72
-
73
-
74
-
75
-
76
-
77
-
78
-
79
-
80
-
81
-
82
-
83
-
84
-
85
-
86
-
87
-
88
-
89
-
90
-
91
-
92
-
93
-
94
-
95
-
96
-
97
-
98
-
99
-
100
 |
 |

50
KIA Motors_2004 Annual Report
▶3rd phase (2009~2010: Accelerate brand m anagem ent): Upgrade global brand managem ent system.
As part of the efforts to improve brand pow er, Hyundai and Kia will instill differentiated brand images in customers' minds. This approach will expand the core
customer base and increase profitability with brand power with the strength to match product quality. Over the long term , the two companies aim to join the ranks
of the world's top five automakers and top 30 brands.
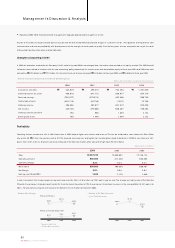
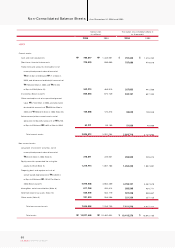
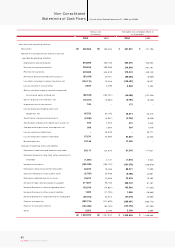
Changes to Accounting in 2004
In 2004, the evaluation method for the Com pany's 18.2% stake in Hyundai Mobis was changed from the market value method to the equity method. The 2003 financial
statements were revised to conform with the new accounting policy retroactively. As a result, assets and shareholders' equity for fiscal years 2003 and 2004 were each
reduced by ₩679.5 billion and ₩729.1 billion. On the other hand, net income increased ₩84.1 billion for fiscal year 2004 and ₩64 billion for fiscal year 2003.
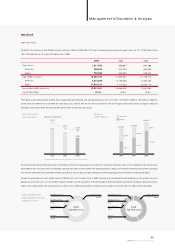
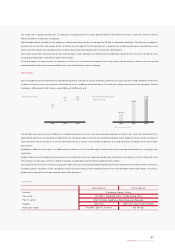
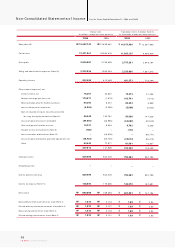
Profitability
Operating incom e to sales was 3.3% in 2004, lower than in 2003 despite higher sales volume and revenue. This can be attributed to som e factors: the Won/ Dollar
rate, which fell ₩57 from the previous year to W1,135, lowered sales revenues, and higher raw material prices raised material cost. COGS to sales ratio rose 2.9%
points, from 78.5% to 81.4%. Discounts were also increased in the domestic market, while sales of the high-value RVs fell in Korea.
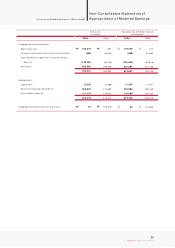
In terms of product mix, the passenger car segment accounted for 48.4% of total sales, up 10.6% points year on year. The change was led by sales of the Morning
(Picanto), the com pany's strategic export model. On the other hand, the portion of RVs, the com pany's mainstream business, in the sales portfolio fell 4.3% points to
40.2%. RV sales continue to grow overseas, but the Korean mini-van market contracted in 2004.
Management’s Discussion & Analysis
499,272
641,772
(279,674)
(20,739)
462,677
579,605
986
1,495
2001 2002 2003
764,453
569,977
402,498
(7,357)
857,572
680,407
1,849
1,849
1,291,049
554,119
990,726
72,746
944,429
769,393
2,123
2,123
Investment securities
Deferred income tax assets
Retained earnings
Capital adjustments
Ordinary income
Net incom e
Ordinary income per share
Earnings per share
333,029
458,978
(765,977)
(329,715)
396,366
349,146
785
785
2000
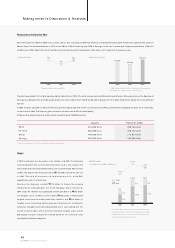
• Effect of change in accounting methods for preceding years Korean won (in millions, except per share amount)
₩₩₩₩
15,257,742
502,455
3.3%
690,569
4.5%
1,972
2004 2003 2002
12,839,881
812,440
6.3%
769,393
6.0%
2,123
12,158,113
658,493
5.4%
680,407
5.6%
1,849
Sales
Operating Income
Operating Margin
Net Income
Net Margin
Earnings per Share(KRW)
(Korean won in millions)
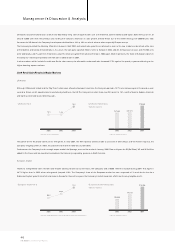
• Product Mix Change • Portion of RV Sales Revenue
(% of Total Revenue)
2002
40.7%
2003
44.5%
2004
40.2%
0.3% 2.6% 4.4%
Portion of RV Sales
Portion of Full-Size Sedan Sales
49.8%
51.8%
47.8%
2002 2003 2004
* Based on Sales Unit
* RV (SUV, Mini-Van, MPV)