Kia 2004 Annual Report Download - page 11
Download and view the complete annual report
Please find page 11 of the 2004 Kia annual report below. You can navigate through the pages in the report by either clicking on the pages listed below, or by using the keyword search tool below to find specific information within the annual report.-
 1
1 -
 2
2 -
 3
3 -
 4
4 -
 5
5 -
 6
6 -
 7
7 -
 8
8 -
 9
9 -
 10
10 -
 11
11 -
 12
12 -
 13
13 -
 14
14 -
 15
15 -
 16
16 -
 17
17 -
 18
18 -
 19
19 -
 20
20 -
 21
21 -
 22
22 -
23
-
24
-
25
-
26
-
27
-
28
-
29
-
30
-
31
-
32
-
33
-
34
-
35
-
36
-
37
-
38
-
39
-
40
-
41
-
42
-
43
-
44
-
45
-
46
-
47
-
48
-
49
-
50
-
51
-
52
-
53
-
54
-
55
-
56
-
57
-
58
-
59
-
60
-
61
-
62
-
63
-
64
-
65
-
66
-
67
-
68
-
69
-
70
-
71
-
72
-
73
-
74
-
75
-
76
-
77
-
78
-
79
-
80
-
81
-
82
-
83
-
84
-
85
-
86
-
87
-
88
-
89
-
90
-
91
-
92
-
93
-
94
-
95
-
96
-
97
-
98
-
99
-
100
 |
 |

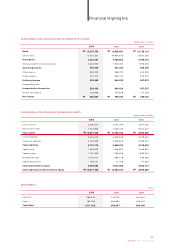
Domestic
Export
Total Sales
319,795
538,902
858,697
444,444
449,824
894,268
250,643
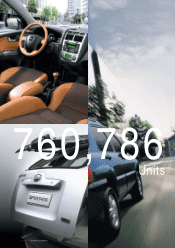
760,786
1,011,429
Sales
Cost of sales
Gross profit
Selling and administrative expenses
Operating income
Other income
Other expense
Ordinary income
Extraordinary item
Income before income tax
Income tax expense
Net income
12,839,881
10,084,078
2,755,803
1,943,363
812,440
588,732
456,743
944,429
–
944,429
175,036
769,393
₩
₩
12,158,113
9,581,392
2,576,721
1,918,228
658,493
624,326
425,247
857,572
–
857,572
177,165
680,407
₩
₩
15,257,742
12,421,361
2,836,381
2,333,926
502,455
899,489
572,475
829,469
–
829,469
138,900
690,569
₩
₩
Current assets
Non-current assets
Total assets
Current liabilities
Long-term liabilities
Total liabilities
Capital stock
Capital surplus
Retained earnings
Capital adjustments
Total shareholders' equity
Total liabilities and shareholders' equity
3,251,294
7,230,739
10,482,033
3,839,030
2,029,923
5,868,953
1,848,652
1,700,956
990,726
72,746
4,613,080
10,482,033
₩
₩
2,921,333
6,041,347
8,962,680
2,679,542
2,339,421
5,018,963
1,848,652
1,699,924
402,498
(-)7,357
3,943,717
8,962,680
₩
₩
2,926,512
7,944,956
10,871,468
3,625,479
2,146,900
5,772,379
1,848,652
1,701,955
1,418,241
130,241
5,099,089
10,871,468
₩
₩
Financial Highlights
11
KIA Motors_2004 Annual Report
SUMMARIZED NON-CONSOLIDATED STATEMENTS OF INCOME
(Korean won in millions)
2004 2003 2002
SUMMARIZED NON-CONSOLIDATED BALANCE SHEETS
(Korean won in millions)
2004 2003 2002
SALES RESULT
(Units)
2004 2003 2002