Kia 2004 Annual Report Download - page 52
Download and view the complete annual report
Please find page 52 of the 2004 Kia annual report below. You can navigate through the pages in the report by either clicking on the pages listed below, or by using the keyword search tool below to find specific information within the annual report.-
 1
1 -
2
-
3
-
4
-
5
-
6
-
7
-
8
-
9
-
10
-
11
-
12
-
13
-
14
-
15
-
16
-
17
-
18
-
19
-
20
-
21
-
22
-
23
-
24
-
25
-
26
-
27
-
28
-
29
-
30
-
31
-
32
-
33
-
34
-
35
-
36
-
37
-
38
-
39
-
40
-
41
-
 42
42 -
 43
43 -
 44
44 -
 45
45 -
 46
46 -
 47
47 -
 48
48 -
 49
49 -
 50
50 -
 51
51 -
 52
52 -
 53
53 -
 54
54 -
 55
55 -
 56
56 -
 57
57 -
 58
58 -
 59
59 -
 60
60 -
 61
61 -
 62
62 -
63
-
64
-
65
-
66
-
67
-
68
-
69
-
70
-
71
-
72
-
73
-
74
-
75
-
76
-
77
-
78
-
79
-
80
-
81
-
82
-
83
-
84
-
85
-
86
-
87
-
88
-
89
-
90
-
91
-
92
-
93
-
94
-
95
-
96
-
97
-
98
-
99
-
100
 |
 |

52
KIA Motors_2004 Annual Report
Management’s Discussion & Analysis
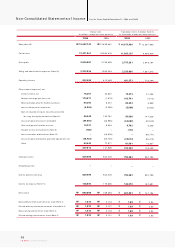
Non-operating Income & Expenses
Non-operating incom e reached ₩899.5 billion in 2004, which was ₩310.8 billion higher than that for the previous year. There were several factors behind this rise.
The gain on foreign exchange transactions, which is linked to exchange rate fluctuation, was up ₩192.2 billion. The Company won lawsuits against financial
institutions, returning ₩84.2 billion of provision for bad debt. After performance results were announced on February 18, the evaluation method for Hyundai Mobis
shares held by the Company was changed from the market value method to the equity method. Subsequently, the gain on equity evaluation method rose from
₩92.6 billion to ₩221.2 billion.
Non-operating expenses increased ₩115.8 billion year on year to ₩572.5 billion. This expense was prompted by ₩13.7 billion increase in interest expenses for
short-term borrowings, ₩121 billion loss on equity evaluation method for the Company affiliates (Hyundai Card, etc.), and ₩23.3 billion loss on the sale of export
trade receivables resulting from the higher export volume.
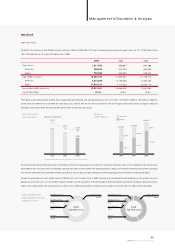
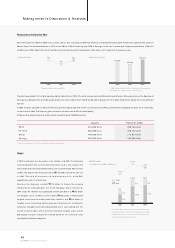
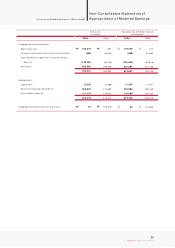
Net Income / EPS / Income Taxes
The strong Won, increased discounts in dom estic market, higher raw material prices and other factors caused operating income to fall 38.1% year on year.
However, net incom e still amounted to ₩690.6 billion, a 10.2% drop from the previous year. The smaller rate in net profit decrease was due to non-operating
income from gains on foreign exchange transactions and equity evaluation, and return of provision for bad debt. Earnings per share shrank 7.1% to ₩1,972.
Income taxes fell 20.6% year on year, as net income was lower and tax incentives were increased for R&D and other facility investment.
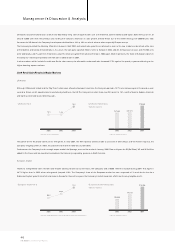
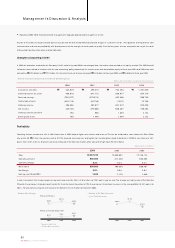
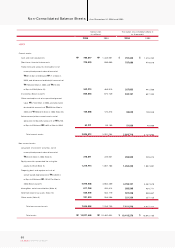
Assets
Current Assets
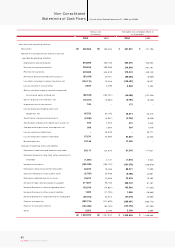
Cash and cash equivalents declined 45.1% from the previous year to ₩790.5 billion. The drop stemmed from payments of matured borrowings, investment in
affiliates, buyback and cancellation of Company stock and increased cash payments for materials used in exported vehicles.
Short-term financial instruments reached ₩770 billion, ₩270 billion increase from the previous year, thanks to efficient managem ent of liquid assets. The share of
"ultra-short-term" financial instruments with a maturity within 90 days shrank, but the share of relatively high-yield short-term financial instruments with various
maturities increased in the Company's portfolio.
• Net Income
(KRW in Billions)
• Change in Number of Shares
(Shares in Millions)
• Earnings per Share
(Korean won)
2002
1,849
2003
2,123
2004
1,972
2002 2003 20042002
680.4
2003
769.4
2004
690.6
369
359
347
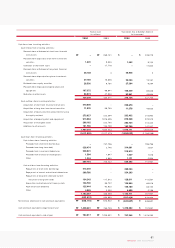
10,871,468
5,772,379
5,099,089
113.2%
46.9%
2004 2003 2002
10,482,033
5,868,953
4,613,080
127.2%
44.0%
8,962,680
5,018,963
3,943,717
127.3%
44.0%
Assets
Liabilities
Shareholders' Equity
Debt-to-Equity Ratio
Equity-to-Asset Ratio
(Korean won in millions)