Kia 2004 Annual Report Download - page 51
Download and view the complete annual report
Please find page 51 of the 2004 Kia annual report below. You can navigate through the pages in the report by either clicking on the pages listed below, or by using the keyword search tool below to find specific information within the annual report.-
 1
1 -
2
-
3
-
4
-
5
-
6
-
7
-
8
-
9
-
10
-
11
-
12
-
13
-
14
-
15
-
16
-
17
-
18
-
19
-
20
-
21
-
22
-
23
-
24
-
25
-
26
-
27
-
28
-
29
-
30
-
31
-
32
-
33
-
34
-
35
-
36
-
37
-
38
-
39
-
40
-
 41
41 -
 42
42 -
 43
43 -
 44
44 -
 45
45 -
 46
46 -
 47
47 -
 48
48 -
 49
49 -
 50
50 -
 51
51 -
 52
52 -
 53
53 -
 54
54 -
 55
55 -
 56
56 -
 57
57 -
 58
58 -
 59
59 -
 60
60 -
 61
61 -
62
-
63
-
64
-
65
-
66
-
67
-
68
-
69
-
70
-
71
-
72
-
73
-
74
-
75
-
76
-
77
-
78
-
79
-
80
-
81
-
82
-
83
-
84
-
85
-
86
-
87
-
88
-
89
-
90
-
91
-
92
-
93
-
94
-
95
-
96
-
97
-
98
-
99
-
100
 |
 |
51
KIA Motors_2004 Annual Report
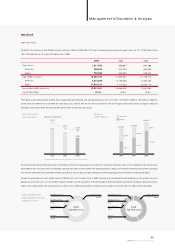
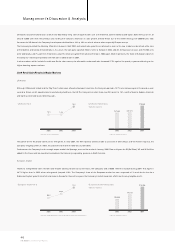
The average sales price (ASP) per unit rose 2% year on year to ₩15.4 million, despite major discount sales campaigns to stimulate sluggish dom estic sales. On the
other hand, export ASP rose 7% to $12,000 thanks to the expanded sales of RVs and other higher priced m odels.
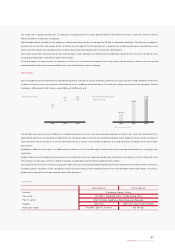
Cost of Goods Sold
COGS stood at ₩12.42 trillion in 2004, or 81.4% of total sales, while the ratio of material cost to total sales was 64.5%, up 3.1% points from 2003. The higher material
cost ratio resulted from rising raw materials costs, revenues dampened by a stronger Won and discount sales in the sluggish domestic market, and sales expansion
for the Morning (Picanto), which is produced on an OEM basis (recognized to material cost). Labor expense was 9.3% of total sales, up 0.1% points from the previous
year because overtime work hours increased w ith the introduction of the five-day work week policy and perform ance incentives rose. The ratio of overhead cost to
total sales was 7.6%, down 0.3% points.
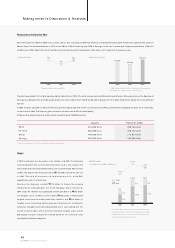
SG&A Expenses
Selling, general and administrative expenses increased 20.1% (₩390.5 billion) to approximately ₩2.33 trillion, 15.3% of total sales, up 0.2% points year on year. The
total labor expense also rose from the previous year, led by wage hikes and incentive payment increases, but labor expense to total sales slid 0.2% points. General
administrative expenses rose 5.5% from the previous year, but its ratio to total sales declined 0.4% points to 2.6% because of higher sales.
Selling cost was 10.1% of total sales in 2004, up 0.8% points from the previous year. Growth in exports forced the company to pay much higher shipping charges
and freight rates, w hile overseas advertising costs also escalated with intensified competition.
The ratio of warranty expense to total sales went slightly dow n to 2.8% from 3.2% in 2003. The marginal slide was mainly due to expanded sales of new vehicles
with improved product quality, which allowed the company to face few er warranty claims and lessen per-unit warranty reserve even though increased exports led
to the growing number of vehicles under warranty and public recalls. Another factor is the Won/Dollar rate at the end of 2004 fell ₩154 from the previous year to
₩1,044. More than 85% of the Company's warranty provision is denom inated as foreign currency, and the figure is converted into Won currency on the basis of the
exchange rate at the end of the term. Therefore, the warranty expense fluctuates with the exchange rate. When the exchange rate fluctuation is not taken into
account, the ratio of warrant expense to total sales is 3.4% in 2004, up 0.2% points year on year.
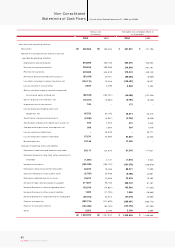
• ASP Change
2002
13.6
2003
15.1
2004
15.4
Dom estic (Million KRW)
2002
9.9
2003
11.2
2004
12.0
Export (Thousand US$)
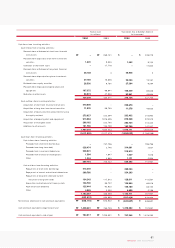
• COGS
(KRW in Billions,
% of Revenue)
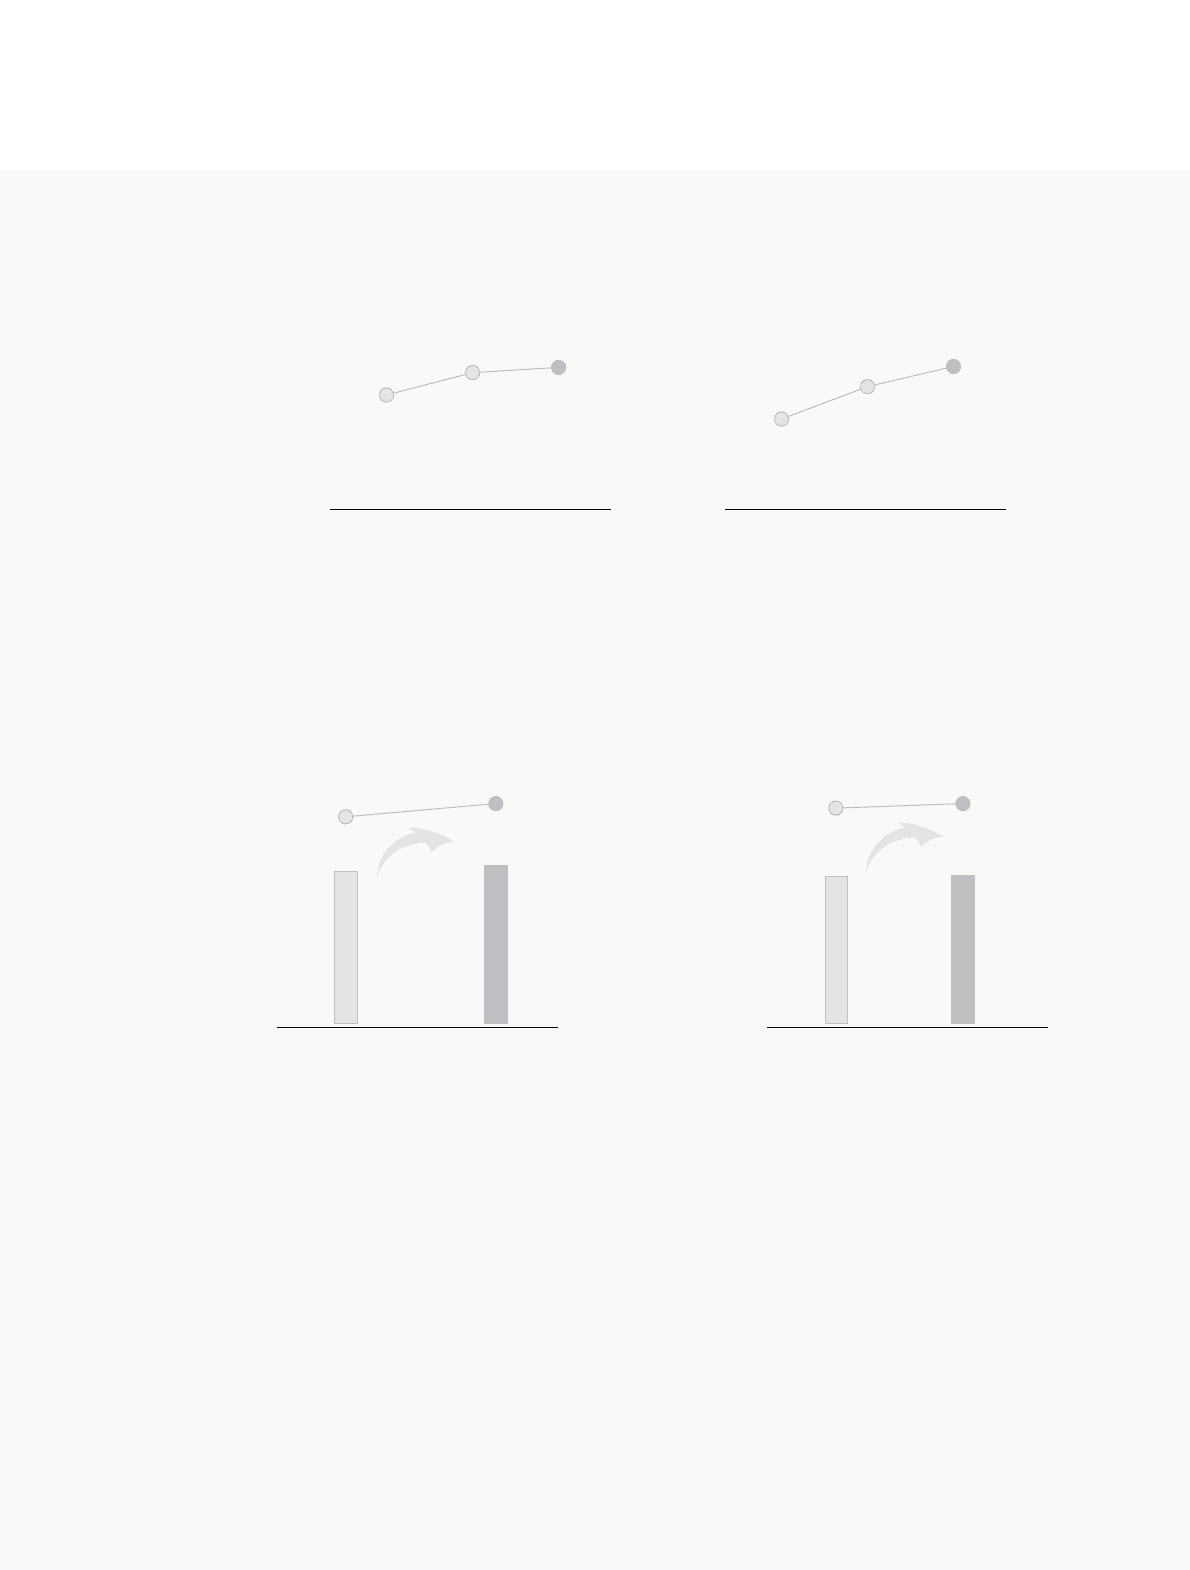
• SG&A
(KRW in Billions,
% of Revenue)
78.5% 81.4%
2003 2004
+2,337.3
(23.2%)
10,084.1 12,421.4
+390.5
(20.1%)
1,943.4 2,333.9
15.1% 15.3%
2003 2004