Kia 2004 Annual Report Download - page 45
Download and view the complete annual report
Please find page 45 of the 2004 Kia annual report below. You can navigate through the pages in the report by either clicking on the pages listed below, or by using the keyword search tool below to find specific information within the annual report.-
 1
1 -
2
-
3
-
4
-
5
-
6
-
7
-
8
-
9
-
10
-
11
-
12
-
13
-
14
-
15
-
16
-
17
-
18
-
19
-
20
-
21
-
22
-
23
-
24
-
25
-
26
-
27
-
28
-
29
-
30
-
31
-
32
-
33
-
34
-
 35
35 -
 36
36 -
 37
37 -
 38
38 -
 39
39 -
 40
40 -
 41
41 -
 42
42 -
 43
43 -
 44
44 -
 45
45 -
 46
46 -
 47
47 -
 48
48 -
 49
49 -
 50
50 -
 51
51 -
 52
52 -
 53
53 -
 54
54 -
 55
55 -
56
-
57
-
58
-
59
-
60
-
61
-
62
-
63
-
64
-
65
-
66
-
67
-
68
-
69
-
70
-
71
-
72
-
73
-
74
-
75
-
76
-
77
-
78
-
79
-
80
-
81
-
82
-
83
-
84
-
85
-
86
-
87
-
88
-
89
-
90
-
91
-
92
-
93
-
94
-
95
-
96
-
97
-
98
-
99
-
100
 |
 |
Management’s Discussion & Analysis
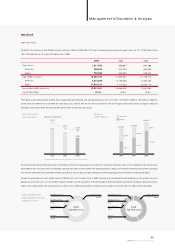
Sales Result
2004 Sales Result
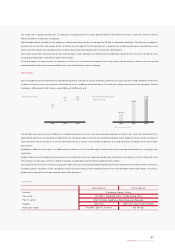
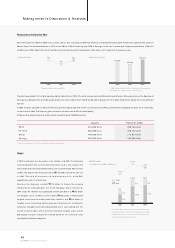
Kia Motors (the Company) sold 250,643 built-up vehicles in Korea in 2004, down 22% from the previous year. However, exports went up 41% to 760,786 units, for
1,011,429 total built-up units sold, 18% higher than in 2003.
The Korean automobile industry suffered from sluggish domestic demand. Car sales declined as much as 17% from 1.32 million in 2003 to 1.09 million in 2004, the
low est level since 1990. Due to the dramatic sales drop such as dow n 39% for the minivan and down 30% for the light commercial vehicle, etc against 2003, the
Com pany's domestic market share also fell 0.8% points from the previous year to 23%.
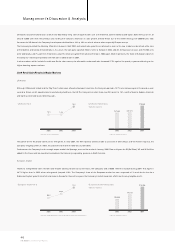
However, boosted by the February launch of the Morning (Picanto), the passenger car share of the Com pany's domestic sales, which had declined for several years,
rebounded to 33%. On top of that, the Sportage com pact SUV came on the market with great popularity in August, reversing the declining sales of RVs (a category
that includes SUVs, Mini-Vans and MPVs in Korea) caused by a new tax regime, higher diesel prices and changing governm ent policy towards autom obiles.
Despite the poor domestic sales, exports reached 760,786 units, or 41% higher than in 2003, making up for the poor dom estic perform ance. The growth was seen
globally, as sales were up 31% in the US, 69% higher in Europe, and 28% greater in the other foreign markets combined. In particular, European sales amounted to
264,412 units, representing 35% of total exports, up from 29% in 2003. Now Europe has nearly the same weight as the US in terms of exports for the Company.
45
KIA Motors_2004 Annual Report
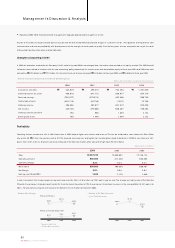
1,011,429
250,643
760,786
15,257,742
4,241,228
11,016,514
12,421,361
81.4%
2004 2003 2002
858,697
319,795
538,902
12,839,881
5,126,358
7,713,523
10,084,078
78.5%
894,268
444,444
449,824
12,158,113
6,304,394
5,853,719
9,581,392
78.8%
Sales (Units)
Domestic
Export
Sales (KRW in millions)
Domestic
Export
Cost of Sales (KRW in millions)
Cost of Sales Ratio
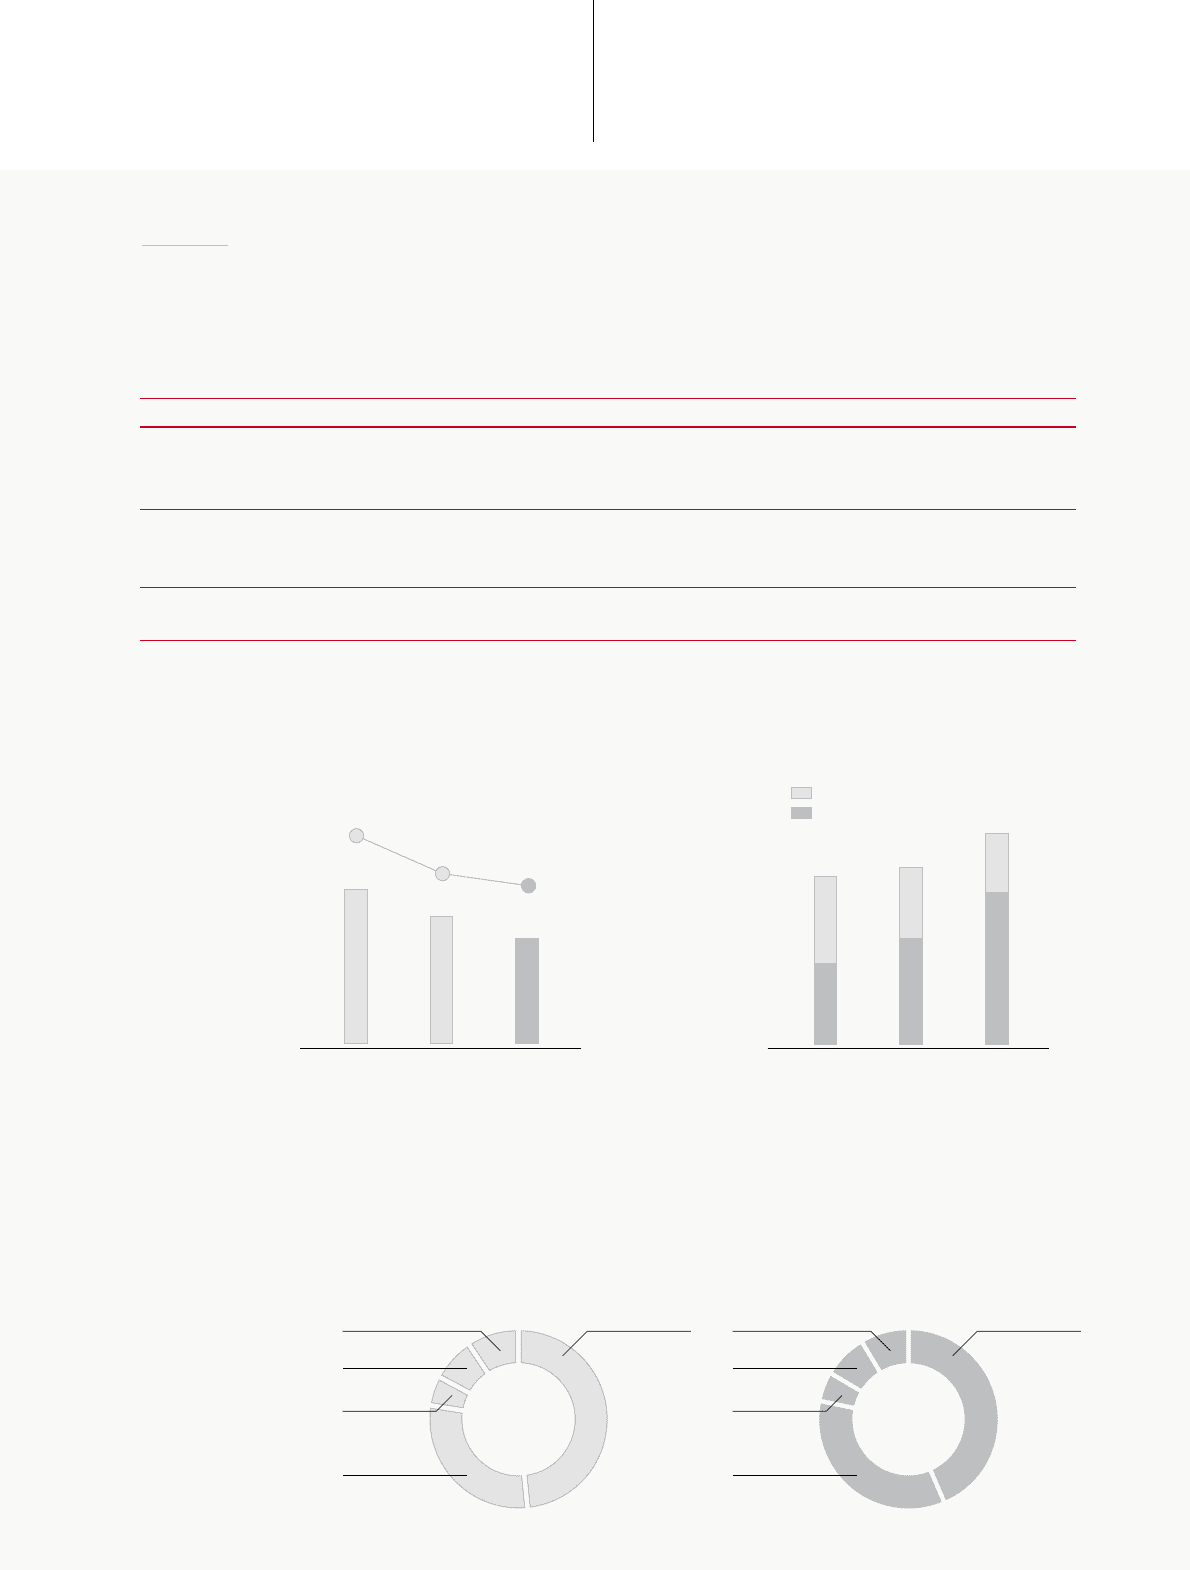
• Industrial Demand
(Thousand Units)
• Export Breakdown by
Region (Based on Number
of Shipment Units)
• Revenue
(KRW in Billions)
1,622
1,318
1,094
2002
26.5%
2003
23.8%
2004
23.0%
Dom estic Market M/ S
2002 2003 2004
12,158.1 12,839.9
15,257.7
6,304.4
5,853.7
5,126.4
7,713.5
4,241.2
11,016.5
Dom estic
Export
Asia/Pacific 8.7% North America
43.5%
Mid East/ Africa
7.8%
Latin America
5.3%
Europe
34.7%
2004
760,786 units
Asia/Pacific 8.7% North America
43.5%
Mid East/ Africa
7.8%
Latin America
5.3%
Europe
34.7%
2003
538,902 units
* Source: KAMA (Korea Autom obile Manufacturers Association)