Kia 2004 Annual Report Download - page 56
Download and view the complete annual report
Please find page 56 of the 2004 Kia annual report below. You can navigate through the pages in the report by either clicking on the pages listed below, or by using the keyword search tool below to find specific information within the annual report.-
 1
1 -
2
-
3
-
4
-
5
-
6
-
7
-
8
-
9
-
10
-
11
-
12
-
13
-
14
-
15
-
16
-
17
-
18
-
19
-
20
-
21
-
22
-
23
-
24
-
25
-
26
-
27
-
28
-
29
-
30
-
31
-
32
-
33
-
34
-
35
-
36
-
37
-
38
-
39
-
40
-
41
-
42
-
43
-
44
-
45
-
 46
46 -
 47
47 -
 48
48 -
 49
49 -
 50
50 -
 51
51 -
 52
52 -
 53
53 -
 54
54 -
 55
55 -
 56
56 -
 57
57 -
 58
58 -
 59
59 -
 60
60 -
 61
61 -
 62
62 -
 63
63 -
 64
64 -
 65
65 -
 66
66 -
67
-
68
-
69
-
70
-
71
-
72
-
73
-
74
-
75
-
76
-
77
-
78
-
79
-
80
-
81
-
82
-
83
-
84
-
85
-
86
-
87
-
88
-
89
-
90
-
91
-
92
-
93
-
94
-
95
-
96
-
97
-
98
-
99
-
100
 |
 |
56
KIA Motors_2004 Annual Report
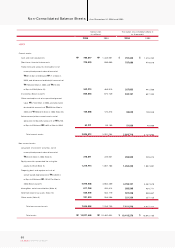
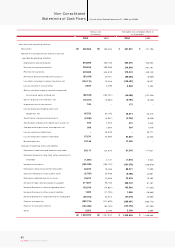
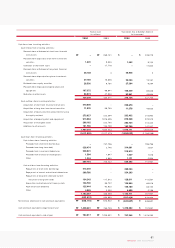
Non-Consolidated Balance Sheets As of December 31, 2004 and 2003
Korean won
(in millions) Translation into U.S.dollars (Note 2)
(in thousands)
ASSETS
Current assets:
Cash and cash equivalents
Short-term financial instruments
Trade notes and accounts receivable, net of
unamortized present value discount of
₩861 million in 2004 and ₩771 million in
2003, and allowance for doubtful accounts of
₩173,646 million in 2004 and ₩212,553
million in 2003 (Note 23)
Inventories (Notes 3 and 7)
Other receivables, net of unamortized present
value ₩5,734 million in 2003, and allowance
for doubtful accounts of ₩49,054 million in
2004 and ₩109,382 million in 2003 (Note 23)
Advances and other current assets, net of
allowance for doubtful accounts of ₩35,746
million in 2004 and ₩33,822 million in 2003
Total current assets
Non-current assets:
Long-term investment securities, net of
unamortized present value discount of
₩5,234 million in 2003 (Note 4)
Equity securities accounted for using the
equity method (Note 5)
Property, plant and equipm ent, net of
accumulated depreciation of ₩2,383,944
million in 2004 and ₩2,151,627 million in
2003 (Notes 6 and 7)
Intangibles, net of amortization (Note 8)
Deferred income tax assets (Note 19)
Other assets (Note 9)
Total non-current assets
Total assets
790,517
770,000
342,213
869,653
100,858
53,271
2,926,512
278,611
1,319,714
4,974,908
611,244
529,445
231,034
7,944,956
10,871,468
₩
₩
2004 2003 2004 2003
1,438,661
500,000
460,910
675,739
125,818
50,166
3,251,294
239,941
1,051,108
4,663,359
453,814
554,119
268,398
7,230,739
10,482,033
757,345
737,689
327,853
833,161
96,626
51,036
2,803,710
266,920
1,264,336
4,766,151
585,595
507,228
221,339
7,611,569
10,415,279
1,378,292
479,019
441,569
647,384
120,539
48,060
3,114,863
229,873
1,007,001
4,467,675
434,771
530,867
257,135
6,927,322
10,042,185
₩
₩
$
$
$
$