Kia 2004 Annual Report Download - page 76
Download and view the complete annual report
Please find page 76 of the 2004 Kia annual report below. You can navigate through the pages in the report by either clicking on the pages listed below, or by using the keyword search tool below to find specific information within the annual report.-
 1
1 -
2
-
3
-
4
-
5
-
6
-
7
-
8
-
9
-
10
-
11
-
12
-
13
-
14
-
15
-
16
-
17
-
18
-
19
-
20
-
21
-
22
-
23
-
24
-
25
-
26
-
27
-
28
-
29
-
30
-
31
-
32
-
33
-
34
-
35
-
36
-
37
-
38
-
39
-
40
-
41
-
42
-
43
-
44
-
45
-
46
-
47
-
48
-
49
-
50
-
51
-
52
-
53
-
54
-
55
-
56
-
57
-
58
-
59
-
60
-
61
-
62
-
63
-
64
-
65
-
 66
66 -
 67
67 -
 68
68 -
 69
69 -
 70
70 -
 71
71 -
 72
72 -
 73
73 -
 74
74 -
 75
75 -
 76
76 -
 77
77 -
 78
78 -
 79
79 -
 80
80 -
 81
81 -
 82
82 -
 83
83 -
 84
84 -
 85
85 -
 86
86 -
87
-
88
-
89
-
90
-
91
-
92
-
93
-
94
-
95
-
96
-
97
-
98
-
99
-
100
 |
 |

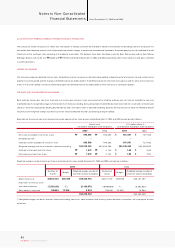
Notes to Non-Consolidated
Financial Statements As of December 31, 2004 and 2003
76
KIA Motors_2004 Annual Report
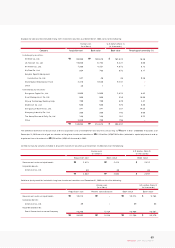
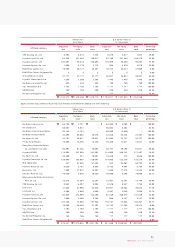
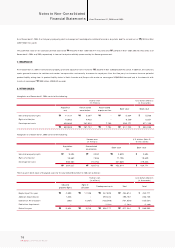
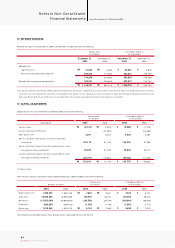
(6) The market price of listed equity securities as of December 31, 2004 is as follows:
The market price of listed equity securities as of December 31, 2003 is as follows:
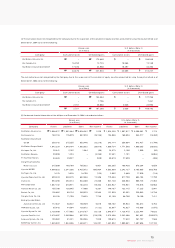
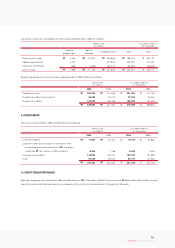
(7) The Company has pledged the follow ing equity securities accounted for using the equity method as collateral for borrowings of EUKOR Car Carriers, Inc. as of
December 31, 2004:
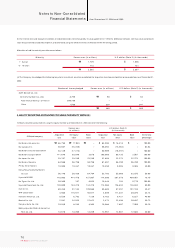
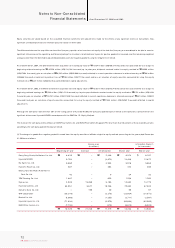
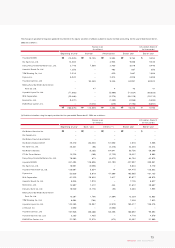
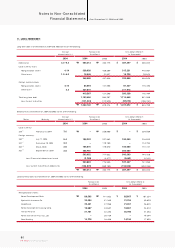
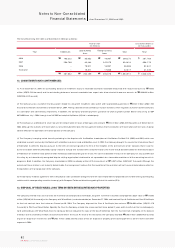
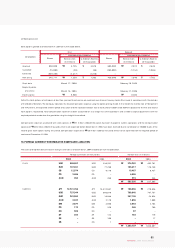
(8) In 2004, the Company early applied the SKAS No. 15 - Equity Method , and changed its accounting methods for the treatment of investm ent securities. As a
result, investment securities accounted for using the equity methods and retained earnings for 2003 have been increased by ₩331,403 million (US$317,497
thousand) and ₩149,649 million(US$143,369 thousand), respectively. Also, long-term investment securities, capital adjustm ents, and deferred income tax assets for
2003 have been reduced by ₩997,276 million (US$955,428 thousand), ₩878,747 million (US$841,873 thousand) and ₩63,226 million (US$60,573 thousand),
respectively. In addition, net income for 2003 has been increased by ₩63,970 million (US$61,286 thousand).
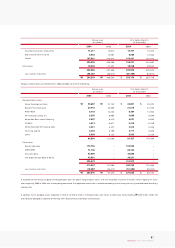
This change in accounting m ethods has been accounted for retrospectively, and the comparative statements for 2003 have been restated. The effect on financial
statements due to early application of the SKAS No.15 for preceding years is as follows:
15,558,120
19,294,680
Number of shares Market value Market value
1,019,057
146,254
₩
976,295
140,117
$
Hyundai MOBIS
Hyundai Hysco Co., Ltd.
Korean won
(In millions) U.S. dollars (Note 2)
(In thousands)
65,500
7,580
Price per shareCompany
₩
15,558,120
19,294,680
Number of shares Market value Market value
1,019,057
146,254
₩
955,427
118,674
$
Hyundai MOBIS
Hyundai Hysco Co., Ltd.
Korean won
(In millions) U.S. dollars (Note 2)
(In thousands)
64,100
6,420
Price per shareCompany
₩
Investment securities
Deferred income
tax assets
Retained earnings
Capital adjustments
Ordinary income
Net incom e
Ordinary income
per share
Earnings per share
Korean won
(in millions, except per share amount) U.S. dollars (Note 2)
(in thousands, except per share amount)
2001 2002 2003 2000 2001 2002 20032000Company
333,029
458,978
(765,977)
(329,715)
396,366
349,146
785
785
₩
499,272
641,772
(279,674)
(20,739)
462,677
579,605
986
1,495
₩
764,453
569,977
402,498
(7,357)
857,572
680,407
1,849
1,849
₩
1,291,049
554,119
990,726
72,746
944,429
769,393
2,123
2,123
₩
319,054
439,718
(733,835)
(315,879)
379,734
334,495
0.75
0.75
$
478,322
614,842
(267,938)
(19,869)
443,262
555,284
0.94
1.43
$
732,375
546,060
385,608
(7,048)
821,587
651,856
1.77
1.77
$
1,236,874
530,867
949,153
69,693
904,799
737,108
2.03
2.03
$
1,760,000
8,000
Number of shares pledged Korean won (in millions) U.S. dollars (Note 2) (in thousands)
33,307
5
33,312
₩
₩
31,909
5
31,914
$
$
EUKOR Car Carriers, Inc.
EUKOR Car Carriers Singapore, Pte.