Kia 2004 Annual Report Download - page 67
Download and view the complete annual report
Please find page 67 of the 2004 Kia annual report below. You can navigate through the pages in the report by either clicking on the pages listed below, or by using the keyword search tool below to find specific information within the annual report.-
 1
1 -
2
-
3
-
4
-
5
-
6
-
7
-
8
-
9
-
10
-
11
-
12
-
13
-
14
-
15
-
16
-
17
-
18
-
19
-
20
-
21
-
22
-
23
-
24
-
25
-
26
-
27
-
28
-
29
-
30
-
31
-
32
-
33
-
34
-
35
-
36
-
37
-
38
-
39
-
40
-
41
-
42
-
43
-
44
-
45
-
46
-
47
-
48
-
49
-
50
-
51
-
52
-
53
-
54
-
55
-
56
-
 57
57 -
 58
58 -
 59
59 -
 60
60 -
 61
61 -
 62
62 -
 63
63 -
 64
64 -
 65
65 -
 66
66 -
 67
67 -
 68
68 -
 69
69 -
 70
70 -
 71
71 -
 72
72 -
 73
73 -
 74
74 -
 75
75 -
 76
76 -
 77
77 -
78
-
79
-
80
-
81
-
82
-
83
-
84
-
85
-
86
-
87
-
88
-
89
-
90
-
91
-
92
-
93
-
94
-
95
-
96
-
97
-
98
-
99
-
100
 |
 |

67
KIA Motors_2004 Annual Report
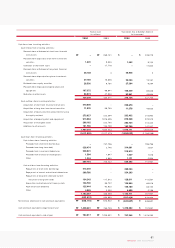
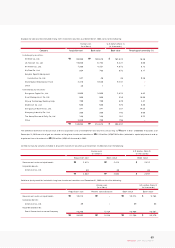
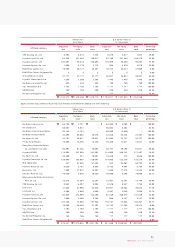
Diluted ordinary income per common share and net income per common share for the years ended December 31, 2004 and 2003 are com puted as follows:
Effect of dilutive securities on weighted average number of common shares outstanding for the years ended December 31, 2004 and 2003 is computed as follows:
(*1) Number of shares, this year: 345,711 - (345,711 ×5,500/10,666)
Number of shares, previous year: 635,565 - (635,565 ×5,500/ 8,927)
(*2) Number of shares, this year: 289,854 - (289,854 ×5,500/10,666)
Number of shares, previous year: 299,435 - (299,435 ×5,500/ 8,927)
Dilutive securities as of December 31, 2004 are as follows.
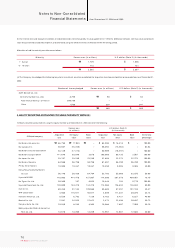
3. INVENTORIES:
Inventories as of December 31, 2004 and 2003 consist of the follow ing:
167,443
140,389
366/366
354/366
2004 2003
Weighted average number of
common shares outstanding
Weight
Number of
shares
Weighted average number of
common shares outstanding
Weight
Number of
shares
243,988
114,951
167,443
135,785
303,228
365/365
344/365
243,988
108,337
352,325
Stock options, not exercised(*1)
Stock options, exercised(*2)
690,569
–
690,569
350,245,262
303,228
350,548,490
1,970
₩
₩
2004 2003 2004 2003
769,393
–
769,393
362,335,493
352,325
362,687,818
2,121
₩
₩
661,591
–
661,591
350,245,262
303,228
350,548,490
1.89
$
$
737,108
–
737,108
362,335,493
352,325
362,687,818
2.03
$
$
Net incom e and ordinary income available to common share
Stock option com pensation expense (salaries)
Ordinary income and net income available to diluted common
share
Weighted average number of comm on shares outstanding
Effect of dilutive securities on weighted average number of
com m on shares outstanding
Diluted ordinary income and net income per common share
Korean won
(In millions except per share amounts) U.S. dollars (Note 2)
(In thousands except per share amounts)
395,210
236,796
173,503
64,144
869,653
₩
₩
2004 2003 2004 2003
282,933
199,986
134,279
58,541
675,739
₩
₩
378,626
226,860
166,222
61,453
833,161
$
$
271,061
191,594
128,644
56,085
647,384
$
$
Finished goods and merchandise
Sem i-finished goods and w ork in process
Raw materials and supplies
Materials in transit
Korean won
(In millions) U.S. dollars (Note 2)
(In thousands)
Stock option 2003.3.18 ~ 2008.3.17
2006.2.20 ~ 2011.2.19
345,711 shares
430,000 shares
5,500(US$5.27)
8,200(US$7.86)
Exercise period Number of dilutive shares Exercise price