Hasbro 2010 Annual Report Download - page 90
Download and view the complete annual report
Please find page 90 of the 2010 Hasbro annual report below. You can navigate through the pages in the report by either clicking on the pages listed below, or by using the keyword search tool below to find specific information within the annual report.-
 1
1 -
2
-
3
-
4
-
5
-
6
-
7
-
8
-
9
-
10
-
11
-
12
-
13
-
14
-
15
-
16
-
17
-
18
-
19
-
20
-
21
-
22
-
23
-
24
-
25
-
26
-
27
-
28
-
29
-
30
-
31
-
32
-
33
-
34
-
35
-
36
-
37
-
38
-
39
-
40
-
41
-
42
-
43
-
44
-
45
-
46
-
47
-
48
-
49
-
50
-
51
-
52
-
53
-
54
-
55
-
56
-
57
-
58
-
59
-
60
-
61
-
62
-
63
-
64
-
65
-
66
-
67
-
68
-
69
-
70
-
71
-
72
-
73
-
74
-
75
-
76
-
77
-
78
-
79
-
 80
80 -
 81
81 -
 82
82 -
 83
83 -
 84
84 -
 85
85 -
 86
86 -
 87
87 -
 88
88 -
 89
89 -
 90
90 -
 91
91 -
 92
92 -
 93
93 -
 94
94 -
 95
95 -
 96
96 -
 97
97 -
 98
98 -
 99
99 -
 100
100 -
101
-
102
-
103
-
104
-
105
-
106
 |
 |

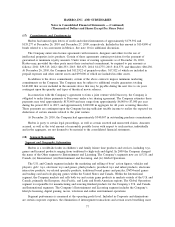
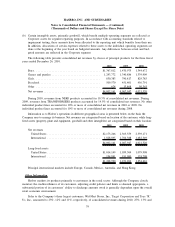
11%, respectively, of consolidated net revenues during 2009 and 25%, 12% and 10% during 2008. These net
revenues were primarily within the U.S. and Canada segment.
Hasbro purchases certain components used in its manufacturing process and certain finished products from
manufacturers in the Far East. The Company’s reliance on external sources of manufacturing can be shifted, over
a period of time, to alternative sources of supply for products it sells, should such changes be necessary.
However, if the Company were prevented from obtaining products from a substantial number of its current Far
East suppliers due to political, labor or other factors beyond its control, the Company’s operations would be
disrupted, potentially for a significant period of time, while alternative sources of product were secured. The
imposition of trade sanctions, quotas or other protectionist measures by the United States or the European Union
against a class of products imported by Hasbro from, or the loss of “normal trade relations” status by, China
could significantly increase the cost of the Company’s products imported into the United States or Europe.
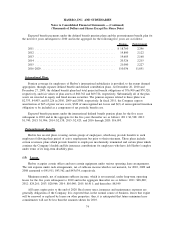
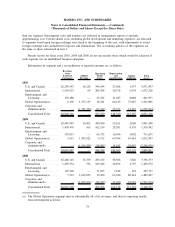
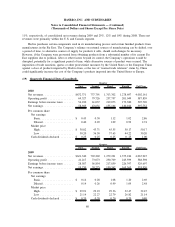
(19) Quarterly Financial Data (Unaudited)
First Second Third Fourth Full Year
Quarter
2010
Net revenues ................... $672,371 737,791 1,313,302 1,278,697 4,002,161
Operating profit ................ 69,327 79,726 237,757 201,049 587,859
Earnings before income taxes ...... 54,230 61,037 219,073 173,380 507,720
Net earnings ................... 58,943 43,631 155,164 140,014 397,752
Per common share
Net earnings
Basic ..................... $ 0.43 0.30 1.12 1.02 2.86
Diluted ................... 0.40 0.29 1.09 0.99 2.74
Market price
High ..................... $ 38.82 43.71 45.55 50.17 50.17
Low ..................... 30.20 36.50 37.65 44.22 30.20
Cash dividends declared ........ $ 0.25 0.25 0.25 0. 25 1.00
First Second Third Fourth Full Year
Quarter
2009
Net revenues ................... $621,340 792,202 1,279,221 1,375,184 4,067,947
Operating profit ................ 41,217 73,073 230,709 243,599 588,598
Earnings before income taxes ...... 28,587 56,854 217,859 226,397 529,697
Net earnings ................... 19,730 39,275 150,362 165,563 374,930
Per common share
Net earnings
Basic ..................... $ 0.14 0.28 1.08 1.20 2.69
Diluted ................... 0.14 0.26 0.99 1.09 2.48
Market price
High ..................... $ 29.91 29.23 29.36 32.47 32.47
Low ..................... 21.14 22.27 22.79 26.82 21.14
Cash dividends declared ........ $ 0.20 0.20 0.20 0.20 0.80
80
HASBRO, INC. AND SUBSIDIARIES
Notes to Consolidated Financial Statements — (Continued)
(Thousands of Dollars and Shares Except Per Share Data)