Hasbro 2010 Annual Report Download - page 39
Download and view the complete annual report
Please find page 39 of the 2010 Hasbro annual report below. You can navigate through the pages in the report by either clicking on the pages listed below, or by using the keyword search tool below to find specific information within the annual report.-
 1
1 -
2
-
3
-
4
-
5
-
6
-
7
-
8
-
9
-
10
-
11
-
12
-
13
-
14
-
15
-
16
-
17
-
18
-
19
-
20
-
21
-
22
-
23
-
24
-
25
-
26
-
27
-
28
-
 29
29 -
 30
30 -
 31
31 -
 32
32 -
 33
33 -
 34
34 -
 35
35 -
 36
36 -
 37
37 -
 38
38 -
 39
39 -
 40
40 -
 41
41 -
 42
42 -
 43
43 -
 44
44 -
 45
45 -
 46
46 -
 47
47 -
 48
48 -
 49
49 -
50
-
51
-
52
-
53
-
54
-
55
-
56
-
57
-
58
-
59
-
60
-
61
-
62
-
63
-
64
-
65
-
66
-
67
-
68
-
69
-
70
-
71
-
72
-
73
-
74
-
75
-
76
-
77
-
78
-
79
-
80
-
81
-
82
-
83
-
84
-
85
-
86
-
87
-
88
-
89
-
90
-
91
-
92
-
93
-
94
-
95
-
96
-
97
-
98
-
99
-
100
-
101
-
102
-
103
-
104
-
105
-
106
 |
 |

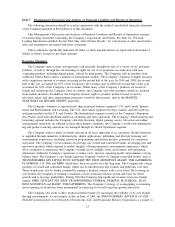
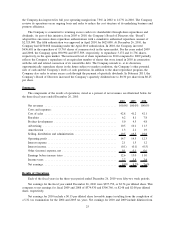
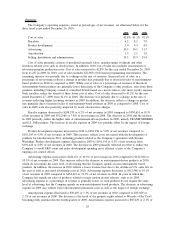
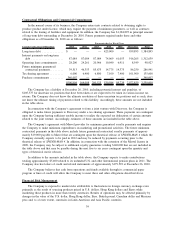
Expenses
The Company’s operating expenses, stated as percentages of net revenues, are illustrated below for the
three fiscal years ended December 26, 2010:
2010 2009 2008
Cost of sales ................................................. 42.8% 41.2% 42.1%
Royalties .................................................... 6.2 8.1 7.8
Product development ........................................... 5.0 4.5 4.8
Advertising .................................................. 10.5 10.1 11.3
Amortization ................................................. 1.3 2.1 1.9
Selling, distribution and administration .............................. 19.5 19.5 19.8
Cost of sales primarily consists of purchased materials, labor, manufacturing overheads and other
inventory-related costs such as obsolescence. In addition, 2010 cost of sales also includes amortization of
television program production costs. Cost of sales increased to 42.8% for the year ended December 26, 2010
from 41.2% in 2009. In 2010, cost of sales includes $22,069 of television programming amortization. The
remaining increase was partially due to a change in the mix of revenues. Increased cost of sales as a
percentage of net revenues reflects a change in product mix primarily due to decreased sales of entertainment-
based products in 2010 as compared to 2009. While cost of sales as a percentage of revenues of theatrical
entertainment-based products are generally lower than many of the Company’s other products, sales from these
products, including Company owned or controlled brands based on a movie release, also incur royalty expense.
Such royalties reduce the benefit of these lower cost of sales. Cost of sales decreased to 41.2% for the year
ended December 27, 2009 from 42.1% in 2008. The decrease was partially due to a change in the mix of
revenues reflecting higher licensing revenues in 2009. In addition, the decrease reflects a change in product
mix primarily due to increased sales of entertainment-based products in 2009 as compared to 2008. Cost of
sales in 2009 were also positively impacted by lower obsolescence charges.
Royalty expense decreased to $248,570 or 6.2% of net revenues in 2010 compared to $330,651 or 8.1%
of net revenues in 2009 and $312,986 or 7.8% of net revenues in 2008. The decrease in 2010 and the increase
in 2009 primarily reflect the higher sales of entertainment-driven products in 2009, namely TRANSFORMERS
and G.I. JOE products. The increase in royalty expense in 2009 was partially offset by the impact of foreign
exchange.
Product development expense increased in 2010 to $201,358 or 5.0% of net revenues compared to
$181,195 or 4.5% of net revenues in 2009. This increase reflects costs associated with the development of
products for introduction in 2011, including products related to the Company’s agreement with Sesame
Workshop. Product development expense decreased in 2009 to $181,195 or 4.5% of net revenues from
$191,424 or 4.8% of net revenues in 2008. The decrease in 2009 primarily reflected an effort to reduce the
Company’s overall SKU count and make development spending more efficient as part of the Company’s
ongoing cost control efforts.
Advertising expense increased to $420,651 or 10.5% of net revenues in 2010 compared to $412,580 or
10.1% of net revenues in 2009. This increase reflects the decrease in entertainment-driven products in 2010,
which do not require the same level of advertising that the Company spends on non-entertainment based
products. In addition, the increase in 2010 reflects a lower revenue base due to the decline in U.S. sales late in
the year as well as increased advertising rates in 2010. Advertising expense decreased to $412,580 or 10.1%
of net revenues in 2009 compared to $454,612 or 11.3% of net revenues in 2008. In years in which the
Company has significant sales of products related to major motion picture releases, such as in 2009,
advertising expense as a percentage of revenue is generally lower, as such products do not require the same
level of advertising that the Company spends on non-entertainment based products. The decrease in advertising
expense in 2009 also reflects lower advertisement placement costs as well as the impact of foreign exchange.
Amortization expense decreased to $50,405 or 1.3% of net revenues in 2010 compared to $85,029 or
2.1% of net revenues in 2009. The decrease is the result of the property rights related to Wizards of the Coast
becoming fully amortized in the fourth quarter of 2009. Amortization expense increased to $85,029 or 2.1% of
29