Hasbro 2010 Annual Report Download - page 40
Download and view the complete annual report
Please find page 40 of the 2010 Hasbro annual report below. You can navigate through the pages in the report by either clicking on the pages listed below, or by using the keyword search tool below to find specific information within the annual report.-
 1
1 -
2
-
3
-
4
-
5
-
6
-
7
-
8
-
9
-
10
-
11
-
12
-
13
-
14
-
15
-
16
-
17
-
18
-
19
-
20
-
21
-
22
-
23
-
24
-
25
-
26
-
27
-
28
-
29
-
 30
30 -
 31
31 -
 32
32 -
 33
33 -
 34
34 -
 35
35 -
 36
36 -
 37
37 -
 38
38 -
 39
39 -
 40
40 -
 41
41 -
 42
42 -
 43
43 -
 44
44 -
 45
45 -
 46
46 -
 47
47 -
 48
48 -
 49
49 -
 50
50 -
51
-
52
-
53
-
54
-
55
-
56
-
57
-
58
-
59
-
60
-
61
-
62
-
63
-
64
-
65
-
66
-
67
-
68
-
69
-
70
-
71
-
72
-
73
-
74
-
75
-
76
-
77
-
78
-
79
-
80
-
81
-
82
-
83
-
84
-
85
-
86
-
87
-
88
-
89
-
90
-
91
-
92
-
93
-
94
-
95
-
96
-
97
-
98
-
99
-
100
-
101
-
102
-
103
-
104
-
105
-
106
 |
 |

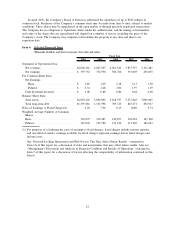
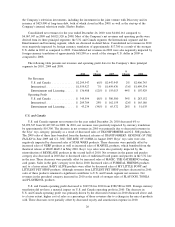
net revenues in 2009 compared to $78,265 or 1.9% of net revenues in 2008. The increase was primarily a
result of accelerated amortization related to a write-down of the carrying value of certain property rights as
well as the purchase of the intellectual property rights related to TRIVIAL PURSUIT in the second quarter of
2008. Property rights of $80,800 were recorded as a result of the purchase of TRIVIAL PURSUIT and are
being amortized over fifteen years.
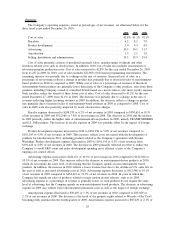
Selling, distribution and administration expenses decreased in dollars but remained flat as a percentage of
revenues in 2010. These expenses were $781,192 or 19.5% of revenues compared to $793,558 or 19.5% of
revenues in 2009. The 2009 amount includes approximately $7,200 of transaction costs related to the
Company’s purchase of a 50% interest in THE HUB television network. The remaining decrease relates to
management incentive and other compensation expenses in 2010 partially offset by higher marketing and sales
costs related to emerging markets and our television initiatives. Selling, distribution and administration
expenses decreased to $793,558 or 19.5% of net revenues in 2009, compared to $797,209 or 19.8% of net
revenues in 2008. Absent the impact of foreign exchange, selling, distribution and administration expenses
increased in 2009. Included in selling, distribution and administration expenses in 2009 were approximately
$7,200 in transaction costs discussed above. The increase in selling, distribution and administration expense in
2009 also reflected higher incentive compensation expense as well as costs related to the start up of the
Company’s television studio and continued investments in emerging markets. Selling, distribution and
administration expense was also positively impacted by lower shipping and distribution costs in 2009. In
addition, selling, distribution and administration expenses in 2008 were positively impacted by the recognition
of a pension surplus in the United Kingdom of approximately $6,000.
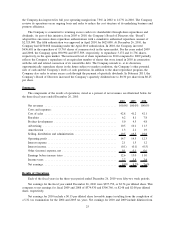
Interest Expense
Interest expense increased to $82,112 in 2010 from $61,603 in 2009. The 2009 interest expense amount
includes approximately $4,000 in costs related to a short-term borrowing facility commitment the Company
entered into in April 2009 in connection with the Company’s anticipated investment in the joint venture with
Discovery. Absent this charge, the increase was primarily due to higher outstanding borrowings and, to a lesser
extent, higher average borrowing rates. The higher average borrowings reflect the issuance of $425,000 in
principal amount of Notes in May 2009 and $500,000 in principal amount of Notes in March 2010, partially
offset by the conversion and redemption of the 2.75% contingent convertible debentures during March and
April of 2010. The proceeds from the issuance of the Notes in May 2009 were primarily used to purchase a
50% interest in THE HUB. The increase in average borrowing rates in 2010 is due to the issuance of Notes in
March 2010, which bear interest at the rate of 6.35%, partially offset by the conversion and redemption of the
contingent convertible debentures during March and April 2010, which bore interest at 2.75%. Interest expense
increased to $61,603 in 2009 from $47,143 in 2008. The increase in interest expense reflects both higher
outstanding borrowings and a higher average borrowing rate as a result of the issuance of $425,000 of notes in
May 2009. As noted above, interest expense in 2009 also includes approximately $4,000 in costs related to a
short-term borrowing facility commitment the Company entered into in April 2009 in connection with the
Company’s anticipated investment in the joint venture with Discovery. In addition, interest expense in 2010
and 2009 include amounts related to the Company’s tax sharing agreement with Discovery.
Interest Income
Interest income was $5,649 in 2010 compared to $2,858 in 2009. The increase primarily reflects higher
invested cash balances in 2010. Interest income was $2,858 in 2009 compared to $17,654 in 2008. The
decrease in interest income was primarily the result of lower returns on invested cash as well as lower average
invested cash balances.
Other (Income) Expense, Net
Other (income) expense, net of $3,676 in 2010 compares to $156 in 2009. Other (income) expense, net in
2010 and 2009 includes $9,323 and $(3,856), respectively, relating to the Company’s 50% share in the
(earnings) loss of THE HUB. The 2010 amount also includes a gain of $4,950 on the sale of a product line.
30