Hasbro 2010 Annual Report Download - page 89
Download and view the complete annual report
Please find page 89 of the 2010 Hasbro annual report below. You can navigate through the pages in the report by either clicking on the pages listed below, or by using the keyword search tool below to find specific information within the annual report.-
 1
1 -
2
-
3
-
4
-
5
-
6
-
7
-
8
-
9
-
10
-
11
-
12
-
13
-
14
-
15
-
16
-
17
-
18
-
19
-
20
-
21
-
22
-
23
-
24
-
25
-
26
-
27
-
28
-
29
-
30
-
31
-
32
-
33
-
34
-
35
-
36
-
37
-
38
-
39
-
40
-
41
-
42
-
43
-
44
-
45
-
46
-
47
-
48
-
49
-
50
-
51
-
52
-
53
-
54
-
55
-
56
-
57
-
58
-
59
-
60
-
61
-
62
-
63
-
64
-
65
-
66
-
67
-
68
-
69
-
70
-
71
-
72
-
73
-
74
-
75
-
76
-
77
-
78
-
 79
79 -
 80
80 -
 81
81 -
 82
82 -
 83
83 -
 84
84 -
 85
85 -
 86
86 -
 87
87 -
 88
88 -
 89
89 -
 90
90 -
 91
91 -
 92
92 -
 93
93 -
 94
94 -
 95
95 -
 96
96 -
 97
97 -
 98
98 -
 99
99 -
100
-
101
-
102
-
103
-
104
-
105
-
106
 |
 |

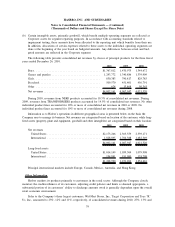
(b) Certain intangible assets, primarily goodwill, which benefit multiple operating segments are reflected as
Corporate assets for segment reporting purposes. In accordance with accounting standards related to
impairment testing, these amounts have been allocated to the reporting unit which benefits from their use.
In addition, allocations of certain expenses related to these assets to the individual operating segments are
done at the beginning of the year based on budgeted amounts. Any differences between actual and bud-
geted amounts are reflected in the Corporate segment.
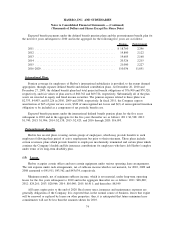
The following table presents consolidated net revenues by classes of principal products for the three fiscal
years ended December 26, 2010.
2010 2009 2008
Boys .......................................... $1,367,812 1,470,975 1,344,672
Games and puzzles ............................... 1,293,772 1,340,886 1,339,909
Girls .......................................... 830,383 790,817 829,785
Preschool ...................................... 509,570 451,401 456,791
Other ......................................... 624 13,868 50,363
Net revenues .................................... $4,002,161 4,067,947 4,021,520
During 2010, revenues from NERF products accounted for 10.3% of consolidated net revenues. During
2009, revenues from TRANSFORMERS products accounted for 14.5% of consolidated net revenues. No other
individual product lines accounted for 10% or more of consolidated net revenues in 2010 or 2009. No
individual product lines accounted for 10% or more of consolidated net revenues during 2008.
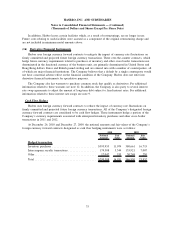
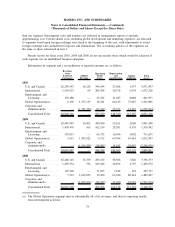
Information as to Hasbro’s operations in different geographical areas is presented below on the basis the
Company uses to manage its business. Net revenues are categorized based on location of the customer, while long-
lived assets (property, plant and equipment, goodwill and other intangibles) are categorized based on their location:
2010 2009 2008
Net revenues
United States .................................. $2,173,266 2,363,559 2,339,171
International .................................. 1,828,895 1,704,388 1,682,349
$4,002,161 4,067,947 4,021,520
Long-lived assets
United States .................................. $1,014,149 1,059,304 1,079,908
International .................................. 194,841 191,900 174,708
$1,208,990 1,251,204 1,254,616
Principal international markets include Europe, Canada, Mexico, Australia, and Hong Kong.
Other Information
Hasbro markets its products primarily to customers in the retail sector. Although the Company closely
monitors the creditworthiness of its customers, adjusting credit policies and limits as deemed appropriate, a
substantial portion of its customers’ ability to discharge amounts owed is generally dependent upon the overall
retail economic environment.
Sales to the Company’s three largest customers, Wal-Mart Stores, Inc., Target Corporation and Toys “R”
Us, Inc., amounted to 23%, 12% and 11%, respectively, of consolidated revenues during 2010, 25%, 13% and
79
HASBRO, INC. AND SUBSIDIARIES
Notes to Consolidated Financial Statements — (Continued)
(Thousands of Dollars and Shares Except Per Share Data)