Hasbro 2010 Annual Report Download - page 81
Download and view the complete annual report
Please find page 81 of the 2010 Hasbro annual report below. You can navigate through the pages in the report by either clicking on the pages listed below, or by using the keyword search tool below to find specific information within the annual report.-
 1
1 -
2
-
3
-
4
-
5
-
6
-
7
-
8
-
9
-
10
-
11
-
12
-
13
-
14
-
15
-
16
-
17
-
18
-
19
-
20
-
21
-
22
-
23
-
24
-
25
-
26
-
27
-
28
-
29
-
30
-
31
-
32
-
33
-
34
-
35
-
36
-
37
-
38
-
39
-
40
-
41
-
42
-
43
-
44
-
45
-
46
-
47
-
48
-
49
-
50
-
51
-
52
-
53
-
54
-
55
-
56
-
57
-
58
-
59
-
60
-
61
-
62
-
63
-
64
-
65
-
66
-
67
-
68
-
69
-
70
-
 71
71 -
 72
72 -
 73
73 -
 74
74 -
 75
75 -
 76
76 -
 77
77 -
 78
78 -
 79
79 -
 80
80 -
 81
81 -
 82
82 -
 83
83 -
 84
84 -
 85
85 -
 86
86 -
 87
87 -
 88
88 -
 89
89 -
 90
90 -
 91
91 -
92
-
93
-
94
-
95
-
96
-
97
-
98
-
99
-
100
-
101
-
102
-
103
-
104
-
105
-
106
 |
 |

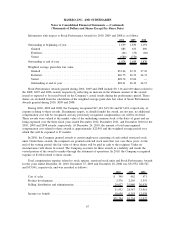
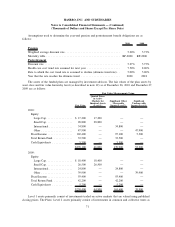
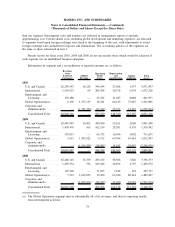
Assumptions used to determine the year-end pension and postretirement benefit obligations are as
follows:
2010 2009
Pension
Weighted average discount rate ................................... 5.20% 5.73%
Mortality table . . . ............................................ RP-2000 RP-2000
Postretirement
Discount rate ................................................ 5.27% 5.75%
Health care cost trend rate assumed for next year ..................... 7.50% 8.00%
Rate to which the cost trend rate is assumed to decline (ultimate trend rate) . . 5.00% 5.00%
Year that the rate reaches the ultimate trend ......................... 2020 2018
The assets of the funded plans are managed by investment advisors. The fair values of the plan assets by
asset class and fair value hierarchy level (as described in note 12) as of December 26, 2010 and December 27,
2009 are as follows:
Fair Value
Quoted Prices
in Active
Markets for
Identical Assets
(Level 1)
Significant Other
Observable
Inputs (Level 2)
Significant
Unobservable
Inputs (Level 3)
Fair Value Measurements Using:
2010:
Equity:
LargeCap................. $ 17,200 17,200 — —
Small Cap................. 28,800 28,800 — —
International ............... 34,800 — 34,800 —
Other .................... 47,900 — — 47,900
Fixed Income ................ 102,400 — 97,100 5,300
Total Return Fund ............. 33,500 — 33,500 —
Cash Equivalents ............. 5,500 — 5,500 —
$270,100 46,000 170,900 53,200
2009:
Equity:
LargeCap................. $ 18,400 18,400 — —
Small Cap................. 26,500 26,500 — —
International ............... 24,800 — 24,800 —
Other .................... 39,900 — — 39,900
Fixed Income ................ 93,400 — 93,400 —
Total Return Fund ............. 42,200 — 42,200 —
Cash Equivalents ............. 5,200 — 5,200 —
$250,400 44,900 165,600 39,900
Level 1 assets primarily consist of investments traded on active markets that are valued using published
closing prices. The Plans’ Level 2 assets primarily consist of investments in common and collective trusts as
71
HASBRO, INC. AND SUBSIDIARIES
Notes to Consolidated Financial Statements — (Continued)
(Thousands of Dollars and Shares Except Per Share Data)