Hasbro 2010 Annual Report Download - page 36
Download and view the complete annual report
Please find page 36 of the 2010 Hasbro annual report below. You can navigate through the pages in the report by either clicking on the pages listed below, or by using the keyword search tool below to find specific information within the annual report.-
 1
1 -
2
-
3
-
4
-
5
-
6
-
7
-
8
-
9
-
10
-
11
-
12
-
13
-
14
-
15
-
16
-
17
-
18
-
19
-
20
-
21
-
22
-
23
-
24
-
25
-
 26
26 -
 27
27 -
 28
28 -
 29
29 -
 30
30 -
 31
31 -
 32
32 -
 33
33 -
 34
34 -
 35
35 -
 36
36 -
 37
37 -
 38
38 -
 39
39 -
 40
40 -
 41
41 -
 42
42 -
 43
43 -
 44
44 -
 45
45 -
 46
46 -
47
-
48
-
49
-
50
-
51
-
52
-
53
-
54
-
55
-
56
-
57
-
58
-
59
-
60
-
61
-
62
-
63
-
64
-
65
-
66
-
67
-
68
-
69
-
70
-
71
-
72
-
73
-
74
-
75
-
76
-
77
-
78
-
79
-
80
-
81
-
82
-
83
-
84
-
85
-
86
-
87
-
88
-
89
-
90
-
91
-
92
-
93
-
94
-
95
-
96
-
97
-
98
-
99
-
100
-
101
-
102
-
103
-
104
-
105
-
106
 |
 |

the Company’s television investments, including the investment in the joint venture with Discovery and its
issuance of $425,000 of long-term debt, both of which closed in May 2009, as well as the start-up of the
Company’s internal television studio, Hasbro Studios.
Consolidated net revenues for the year ended December 26, 2010 were $4,002,161 compared to
$4,067,947 in 2009 and $4,021,520 in 2008. Most of the Company’s net revenues and operating profits were
derived from its three principal segments: the U.S. and Canada segment, the International segment and the
Entertainment and Licensing segment, which are discussed in detail below. Consolidated net revenues in 2010
were negatively impacted by foreign currency translation of approximately $17,700 as a result of the stronger
U.S. dollar in 2010 as compared to 2009. Consolidated net revenues in 2009 were also negatively impacted by
foreign currency translation of approximately $65,200 as a result of the stronger U.S. dollar in 2009 as
compared to 2008.
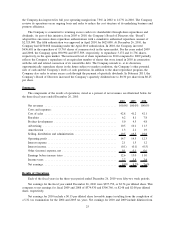
The following table presents net revenues and operating profit data for the Company’s three principal
segments for 2010, 2009 and 2008.
2010
%
Change 2009
%
Change 2008
Net Revenues
U.S. and Canada .............. $2,299,547 (6)% $2,447,943 2% $2,406,745
International .................. $1,559,927 7% $1,459,476 (3)% $1,499,334
Entertainment and Licensing ...... $ 136,488 (12)% $ 155,013 44% $ 107,929
Operating Profit
U.S. and Canada .............. $ 349,594 (8)% $ 380,580 34% $ 283,152
International .................. $ 209,704 29% $ 162,159 (2)% $ 165,186
Entertainment and Licensing ...... $ 43,234 (34)% $ 65,572 28% $ 51,035
U.S. and Canada
U.S. and Canada segment net revenues for the year ended December 26, 2010 decreased 6% to
$2,299,547 from $2,447,943 in 2009. In 2010, net revenues were positively impacted by currency translation
by approximately $10,300. The decrease in net revenues in 2010 was primarily due to decreased revenues in
the boys’ toys category, primarily as a result of decreased sales of TRANSFORMERS and G.I. JOE products.
The 2009 sales of these lines benefited from the theatrical releases of TRANSFORMERS: REVENGE OF THE
FALLEN in June 2009 and G.I. JOE: THE RISE OF COBRA in August 2009. Boys’ toys sales were also
negatively impacted by decreased sales of STAR WARS products. These decreases were partially offset by
increased sales of NERF products as well as increased sales of MARVEL products, which benefited from the
theatrical release of IRON MAN 2 in May 2010. Boys’ toys sales were also positively impacted by the
reintroduction of BEYBLADE products in the second half of 2010. Net revenues in the games and puzzles
category also decreased in 2010 due to decreased sales of traditional board games and puzzles in the U.S. late
in the year. These decreases were partially offset by increased sales of MAGIC: THE GATHERING trading
card games. Sales in the girls’ category were flat in 2010. Increased sales of FURREAL FRIENDS products
and, to a lesser extent, BABY ALIVE products were offset by decreased sales of MY LITTLE PONY and
LITTLEST PET SHOP products. Although revenues from LITTLEST PET SHOP products decreased in 2010,
sales of these products remained a significant contributor to U.S. and Canada segment net revenues. Net
revenues in the preschool category increased in 2010 as the result of stronger sales of PLAY-DOH, TONKA
and PLAYSKOOL products.
U.S. and Canada operating profit decreased to $349,594 in 2010 from $380,580 in 2009. Foreign currency
translation did not have a material impact on U.S. and Canada operating profit in 2010. The decrease in
U.S. and Canada operating profit was primarily driven by the decreased revenues in 2010 discussed above and,
to a lesser extent, higher cost of sales as a percentage of those revenues due to a change in the mix of products
sold. These decreases were partially offset by decreased royalty and amortization expense in 2010.
26