Hasbro 2010 Annual Report Download - page 37
Download and view the complete annual report
Please find page 37 of the 2010 Hasbro annual report below. You can navigate through the pages in the report by either clicking on the pages listed below, or by using the keyword search tool below to find specific information within the annual report.-
 1
1 -
2
-
3
-
4
-
5
-
6
-
7
-
8
-
9
-
10
-
11
-
12
-
13
-
14
-
15
-
16
-
17
-
18
-
19
-
20
-
21
-
22
-
23
-
24
-
25
-
26
-
 27
27 -
 28
28 -
 29
29 -
 30
30 -
 31
31 -
 32
32 -
 33
33 -
 34
34 -
 35
35 -
 36
36 -
 37
37 -
 38
38 -
 39
39 -
 40
40 -
 41
41 -
 42
42 -
 43
43 -
 44
44 -
 45
45 -
 46
46 -
 47
47 -
48
-
49
-
50
-
51
-
52
-
53
-
54
-
55
-
56
-
57
-
58
-
59
-
60
-
61
-
62
-
63
-
64
-
65
-
66
-
67
-
68
-
69
-
70
-
71
-
72
-
73
-
74
-
75
-
76
-
77
-
78
-
79
-
80
-
81
-
82
-
83
-
84
-
85
-
86
-
87
-
88
-
89
-
90
-
91
-
92
-
93
-
94
-
95
-
96
-
97
-
98
-
99
-
100
-
101
-
102
-
103
-
104
-
105
-
106
 |
 |
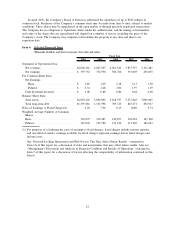
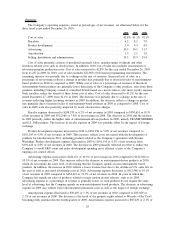
U.S. and Canada segment net revenues for the year ended December 27, 2009 increased 2% to
$2,447,943 from $2,406,745 in 2008. The increase in net revenues in 2009 was primarily due to increased
revenues in the boys’ toys category, primarily as a result of increased sales of TRANSFORMERS and G.I.
JOE products due to the theatrical releases of TRANSFORMERS: REVENGE OF THE FALLEN in June 2009
and G.I. JOE: THE RISE OF COBRA in August 2009, as well as increased sales of NERF products. Increased
sales in the boys’ toys category were partially offset by decreased sales of STAR WARS, MARVEL and
INDIANA JONES products. The increase in U.S. and Canada segment net revenues for 2009 was also due to
increased revenues in the preschool category primarily resulting from higher sales of TONKA and PLAY-DOH
products, partially offset by decreased sales of PLAYSKOOL products. Revenues from sales of PLAYSKOOL
products declined primarily as a result of decreased sales of ROSE PETAL COTTAGE products which are no
longer in the Company’s product line. Revenues from the girls’ toys category decreased primarily as a result
of lower sales of BABY ALIVE and I-DOG products, partially offset by sales of STRAWBERRY SHORT-
CAKE products which were reintroduced to the Company’s line in the second quarter of 2009. Net revenues
in the games and puzzles category decreased slightly in 2009, primarily due to decreased sales of traditional
board games, partially offset by increased revenues from sales of MAGIC: THE GATHERING trading card
games. Net revenues in 2009 were also negatively impacted by decreased sales of TOOTH TUNES products,
which have been discontinued from the Company’s product line.
U.S. and Canada operating profit increased to $380,580 in 2009 from $283,152 in 2008. Operating profit
in 2009 was positively impacted by approximately $3,100 due to the translation of foreign currencies to the
U.S. dollar. U.S. and Canada operating profit increased in 2009 primarily as a result of the increased revenues
discussed above and lower cost of sales as a percentage of those revenues due to lower obsolescence charges
and a change in the mix of products sold, primarily due to increased sales of entertainment-based products in
2009 as compared to 2008. The increase in operating profit for 2009 also reflects decreased selling,
distribution and administration expenses which primarily reflect lower shipping and distribution costs as well
as decreased marketing and sales expenses. In addition, operating profit increased as a result of decreased
advertising expense.
International
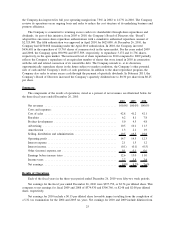
International segment net revenues for the year ended December 26, 2010 increased by 7% to $1,559,927
from $1,459,476 in 2009. In 2010, net revenues were negatively impacted by currency translation of
approximately $27,600 as a result of a stronger U.S. dollar. Excluding the unfavorable impact of foreign
exchange, International segment net revenues increased 9% in local currency in 2010. The increased net
revenues in 2010 were driven by increased sales in all categories as well as growth in emerging markets,
including Brazil, Russia and China. The increase in the boys’ toys category was primarily due to higher sales
of NERF products as well as the reintroduction of BEYBLADE products in 2010. Increased sales of MARVEL
and TONKA products also contributed to the increased sales in the boys’ toys category. These increases were
partially offset by decreases in the TRANSFORMERS and G.I. JOE lines. The increase in net revenues in the
girls’ toys category was primarily driven by increased sales of FURREAL FRIENDS products partially offset
by lower sales of MY LITTLE PONY and LITTLEST PET SHOP products. Preschool category net revenues
increased primarily as the result of stronger sales of PLAY-DOH and PLAYSKOOL products offset by
decreased sales of IN THE NIGHT GARDEN products. Net revenues in the games and puzzles category
increased slightly as a result of increased revenues from MAGIC: THE GATHERING trading card games.
International segment operating profit increased 29% to $209,704 in 2010 from $162,159 in 2009.
Operating profit for the International segment in 2010 was negatively impacted by approximately $11,500 due
to the translation of foreign currencies to the U.S. dollar. The increase in operating profit was primarily driven
by the increased revenues described above. In addition, operating profit was positively impacted by decreased
royalty expense and amortization. These were offset by increased selling, distribution and administrative
expenses.
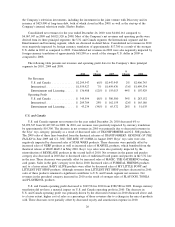
International segment net revenues for the year ended December 27, 2009 decreased by 3% to $1,459,476
from $1,499,334 in 2008. In 2009, net revenues were negatively impacted by currency translation of
approximately $64,500 as a result of a stronger U.S. dollar. Excluding the unfavorable impact of foreign
27