Hasbro 2010 Annual Report Download - page 54
Download and view the complete annual report
Please find page 54 of the 2010 Hasbro annual report below. You can navigate through the pages in the report by either clicking on the pages listed below, or by using the keyword search tool below to find specific information within the annual report.-
 1
1 -
2
-
3
-
4
-
5
-
6
-
7
-
8
-
9
-
10
-
11
-
12
-
13
-
14
-
15
-
16
-
17
-
18
-
19
-
20
-
21
-
22
-
23
-
24
-
25
-
26
-
27
-
28
-
29
-
30
-
31
-
32
-
33
-
34
-
35
-
36
-
37
-
38
-
39
-
40
-
41
-
42
-
43
-
 44
44 -
 45
45 -
 46
46 -
 47
47 -
 48
48 -
 49
49 -
 50
50 -
 51
51 -
 52
52 -
 53
53 -
 54
54 -
 55
55 -
 56
56 -
 57
57 -
 58
58 -
 59
59 -
 60
60 -
 61
61 -
 62
62 -
 63
63 -
 64
64 -
65
-
66
-
67
-
68
-
69
-
70
-
71
-
72
-
73
-
74
-
75
-
76
-
77
-
78
-
79
-
80
-
81
-
82
-
83
-
84
-
85
-
86
-
87
-
88
-
89
-
90
-
91
-
92
-
93
-
94
-
95
-
96
-
97
-
98
-
99
-
100
-
101
-
102
-
103
-
104
-
105
-
106
 |
 |

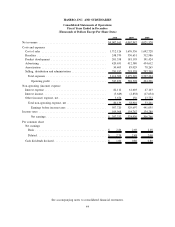
HASBRO, INC. AND SUBSIDIARIES
Consolidated Statements of Operations
Fiscal Years Ended in December
(Thousands of Dollars Except Per Share Data)
2010 2009 2008
Net revenues ........................................... $4,002,161 4,067,947 4,021,520
Costs and expenses
Cost of sales ......................................... 1,712,126 1,676,336 1,692,728
Royalties ............................................ 248,570 330,651 312,986
Product development ................................... 201,358 181,195 191,424
Advertising .......................................... 420,651 412,580 454,612
Amortization ......................................... 50,405 85,029 78,265
Selling, distribution and administration ...................... 781,192 793,558 797,209
Total expenses ...................................... 3,414,302 3,479,349 3,527,224
Operating profit ................................... 587,859 588,598 494,296
Non-operating (income) expense
Interest expense ....................................... 82,112 61,603 47,143
Interest income ........................................ (5,649) (2,858) (17,654)
Other (income) expense, net .............................. 3,676 156 23,752
Total non-operating expense, net ......................... 80,139 58,901 53,241
Earnings before income taxes ......................... 507,720 529,697 441,055
Income taxes ........................................... 109,968 154,767 134,289
Net earnings ...................................... $ 397,752 374,930 306,766
Per common share
Net earnings
Basic ............................................. $ 2.86 2.69 2.18
Diluted ............................................ $ 2.74 2.48 2.00
Cash dividends declared ................................. $ 1.00 0.80 0.80
See accompanying notes to consolidated financial statements.
44