Hasbro 2010 Annual Report Download - page 31
Download and view the complete annual report
Please find page 31 of the 2010 Hasbro annual report below. You can navigate through the pages in the report by either clicking on the pages listed below, or by using the keyword search tool below to find specific information within the annual report.-
 1
1 -
2
-
3
-
4
-
5
-
6
-
7
-
8
-
9
-
10
-
11
-
12
-
13
-
14
-
15
-
16
-
17
-
18
-
19
-
20
-
 21
21 -
 22
22 -
 23
23 -
 24
24 -
 25
25 -
 26
26 -
 27
27 -
 28
28 -
 29
29 -
 30
30 -
 31
31 -
 32
32 -
 33
33 -
 34
34 -
 35
35 -
 36
36 -
 37
37 -
 38
38 -
 39
39 -
 40
40 -
 41
41 -
42
-
43
-
44
-
45
-
46
-
47
-
48
-
49
-
50
-
51
-
52
-
53
-
54
-
55
-
56
-
57
-
58
-
59
-
60
-
61
-
62
-
63
-
64
-
65
-
66
-
67
-
68
-
69
-
70
-
71
-
72
-
73
-
74
-
75
-
76
-
77
-
78
-
79
-
80
-
81
-
82
-
83
-
84
-
85
-
86
-
87
-
88
-
89
-
90
-
91
-
92
-
93
-
94
-
95
-
96
-
97
-
98
-
99
-
100
-
101
-
102
-
103
-
104
-
105
-
106
 |
 |

PART II
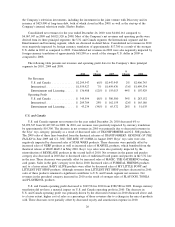
Item 5. Market for Registrant’s Common Equity, Related Stockholder Matters and Issuer Purchases of
Equity Securities
The Company’s common stock, par value $0.50 per share (the “Common Stock”), is traded on The
NASDAQ Global Select Market under the symbol “HAS”. Prior to December 21, 2010, the Common Stock
was traded on the New York Stock Exchange under the same symbol. The following table sets forth the high
and low sales prices in the applicable quarters, as reported on either The NASDAQ Global Select Market for
the period December 21, 2010 through December 26, 2010, or the New York Stock Exchange for the period
December 29, 2008 through December 20, 2010, respectively, as well as the cash dividends declared per share
of Common Stock for the periods listed.
Period High Low
Cash Dividends
Declared
Sales Prices
2010
1st Quarter ....................................... $38.82 30.20 $0.25
2nd Quarter ....................................... 43.71 36.50 0.25
3rd Quarter ....................................... 45.55 37.65 0.25
4th Quarter ....................................... 50.17 44.22 0.25
2009
1st Quarter ....................................... $29.91 21.14 $0.20
2nd Quarter ....................................... 29.23 22.27 0.20
3rd Quarter ....................................... 29.36 22.79 0.20
4th Quarter ....................................... 32.47 26.82 0.20
The approximate number of holders of record of the Company’s Common Stock as of February 7, 2011
was 9,100.
See Part III, Item 12 of this report for the information concerning the Company’s “Equity Compensation
Plans”.
Dividends
Declaration of dividends is at the discretion of the Company’s Board of Directors and will depend upon
the earnings and financial condition of the Company and such other factors as the Board of Directors deems
appropriate.
Issuer Repurchases of Common Stock
Repurchases made in the fourth quarter (in whole numbers of shares and dollars)
Period
(a) Total Number
of Shares (or
Units) Purchased
(b) Average Price
Paid per Share
(or Unit)
(c) Total Number of Shares
(or Units) Purchased as
Part of Publicly Announced
Plans or Programs
(d) Maximum Number
(or Approximate Dollar
Value) of Shares (or
Units) that May Yet Be
Purchased Under the
Plans or Programs
October 2010
9/27/10 — 10/24/10 .... 166,572 $44.7366 166,572 $150,068,118
November 2010
10/25/10 — 11/28/10.... — — — $150,068,118
December 2010
11/29/10 — 12/26/10.... — — — $150,068,118
Total ................. 166,572 $44.7366 166,572 $150,068,118
21