Hasbro 2010 Annual Report Download - page 32
Download and view the complete annual report
Please find page 32 of the 2010 Hasbro annual report below. You can navigate through the pages in the report by either clicking on the pages listed below, or by using the keyword search tool below to find specific information within the annual report.-
 1
1 -
2
-
3
-
4
-
5
-
6
-
7
-
8
-
9
-
10
-
11
-
12
-
13
-
14
-
15
-
16
-
17
-
18
-
19
-
20
-
21
-
 22
22 -
 23
23 -
 24
24 -
 25
25 -
 26
26 -
 27
27 -
 28
28 -
 29
29 -
 30
30 -
 31
31 -
 32
32 -
 33
33 -
 34
34 -
 35
35 -
 36
36 -
 37
37 -
 38
38 -
 39
39 -
 40
40 -
 41
41 -
 42
42 -
43
-
44
-
45
-
46
-
47
-
48
-
49
-
50
-
51
-
52
-
53
-
54
-
55
-
56
-
57
-
58
-
59
-
60
-
61
-
62
-
63
-
64
-
65
-
66
-
67
-
68
-
69
-
70
-
71
-
72
-
73
-
74
-
75
-
76
-
77
-
78
-
79
-
80
-
81
-
82
-
83
-
84
-
85
-
86
-
87
-
88
-
89
-
90
-
91
-
92
-
93
-
94
-
95
-
96
-
97
-
98
-
99
-
100
-
101
-
102
-
103
-
104
-
105
-
106
 |
 |

In April 2010, the Company’s Board of Directors authorized the repurchase of up to $625 million in
common stock. Purchases of the Company’s common stock may be made from time to time, subject to market
conditions. These shares may be repurchased in the open market or through privately negotiated transactions.
The Company has no obligation to repurchase shares under the authorization, and the timing, actual number
and value of the shares that are repurchased will depend on a number of factors, including the price of the
Company’s stock. The Company may suspend or discontinue the program at any time and there is no
expiration date.
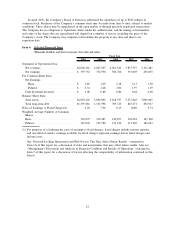
Item 6. Selected Financial Data
(Thousands of dollars and shares except per share data and ratios)
2010 2009 2008 2007 2006
Fiscal Year
Statement of Operations Data:
Net revenues ..................... $4,002,161 4,067,947 4,021,520 3,837,557 3,151,481
Net earnings ...................... $ 397,752 374,930 306,766 333,003 230,055
Per Common Share Data:
Net Earnings
Basic ......................... $ 2.86 2.69 2.18 2.13 1.38
Diluted ........................ $ 2.74 2.48 2.00 1.97 1.29
Cash dividends declared ............. $ 1.00 0.80 0.80 0.64 0.48
Balance Sheet Data:
Total assets ...................... $4,093,226 3,896,892 3,168,797 3,237,063 3,096,905
Total long-term debt ................ $1,397,681 1,131,998 709,723 845,071 494,917
Ratio of Earnings to Fixed Charges(1) .... 6.28 7.96 8.15 10.86 9.74
Weighted Average Number of Common
Shares:
Basic ........................... 139,079 139,487 140,877 156,054 167,100
Diluted.......................... 145,670 152,780 155,230 171,205 181,043
(1) For purposes of calculating the ratio of earnings to fixed charges, fixed charges include interest expense
and one-third of rentals; earnings available for fixed charges represent earnings before fixed charges and
income taxes.
See “Forward-Looking Information and Risk Factors That May Affect Future Results” contained in
Item 1A of this report for a discussion of risks and uncertainties that may affect future results. Also see
“Management’s Discussion and Analysis of Financial Condition and Results of Operations” contained in
Item 7 of this report for a discussion of factors affecting the comparability of information contained in this
Item 6.
22