Hasbro 2010 Annual Report Download - page 56
Download and view the complete annual report
Please find page 56 of the 2010 Hasbro annual report below. You can navigate through the pages in the report by either clicking on the pages listed below, or by using the keyword search tool below to find specific information within the annual report.-
 1
1 -
2
-
3
-
4
-
5
-
6
-
7
-
8
-
9
-
10
-
11
-
12
-
13
-
14
-
15
-
16
-
17
-
18
-
19
-
20
-
21
-
22
-
23
-
24
-
25
-
26
-
27
-
28
-
29
-
30
-
31
-
32
-
33
-
34
-
35
-
36
-
37
-
38
-
39
-
40
-
41
-
42
-
43
-
44
-
45
-
 46
46 -
 47
47 -
 48
48 -
 49
49 -
 50
50 -
 51
51 -
 52
52 -
 53
53 -
 54
54 -
 55
55 -
 56
56 -
 57
57 -
 58
58 -
 59
59 -
 60
60 -
 61
61 -
 62
62 -
 63
63 -
 64
64 -
 65
65 -
 66
66 -
67
-
68
-
69
-
70
-
71
-
72
-
73
-
74
-
75
-
76
-
77
-
78
-
79
-
80
-
81
-
82
-
83
-
84
-
85
-
86
-
87
-
88
-
89
-
90
-
91
-
92
-
93
-
94
-
95
-
96
-
97
-
98
-
99
-
100
-
101
-
102
-
103
-
104
-
105
-
106
 |
 |

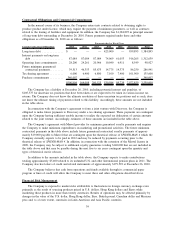
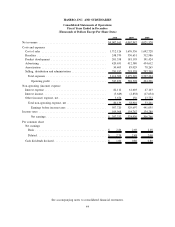
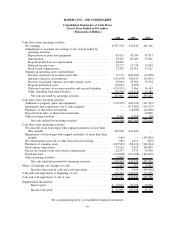
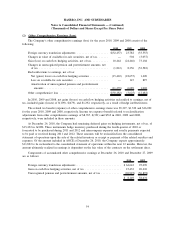
HASBRO, INC. AND SUBSIDIARIES
Consolidated Statements of Shareholders’ Equity
(Thousands of Dollars)
Common
Stock
Additional
Paid-in
Capital
Retained
Earnings
Accumulated
Other
Comprehensive
Earnings
Treasury
Stock
Total
Shareholders’
Equity
Balance, December 30, 2007 . . . $104,847 369,092 2,261,561 74,938 (1,425,346) 1,385,092
Net earnings .............. — — 306,766 — — 306,766
Other comprehensive loss .... — — — (12,682) — (12,682)
Comprehensive earnings . . . 294,084
Stock-based compensation
transactions ............. — 45,947 — — 99,708 145,655
Purchases of common stock . . — — — — (357,589) (357,589)
Stock-based compensation
expense ............... — 35,116 — — 105 35,221
Dividends declared ......... — — (111,677) — — (111,677)
Balance, December 28, 2008 . . . 104,847 450,155 2,456,650 62,256 (1,683,122) 1,390,786
Net earnings .............. — — 374,930 — — 374,930
Other comprehensive loss .... — — — (3,625) — (3,625)
Comprehensive earnings . . . 371,305
Stock-based compensation
transactions ............. — (12,724) — — 17,518 4,794
Purchases of common stock . . — — — — (90,994) (90,994)
Stock-based compensation
expense ............... — 29,752 — — 160 29,912
Dividends declared ......... — — (111,031) — — (111,031)
Balance, December 27, 2009 . . . 104,847 467,183 2,720,549 58,631 (1,756,438) 1,594,772
Net earnings .............. — — 397,752 — — 397,752
Other comprehensive loss .... — — — (50,482) — (50,482)
Comprehensive earnings . . . 347,270
Stock-based compensation
transactions ............. — 22,971 — — 86,253 109,224
Conversion of debentures .... — 102,792 — — 204,635 307,427
Purchases of common stock . . — — — — (636,681) (636,681)
Stock-based compensation
expense ............... — 33,015 — — 377 33,392
Dividends declared ......... — — (139,984) — — (139,984)
Balance, December 26, 2010 . . . $104,847 625,961 2,978,317 8,149 (2,101,854) 1,615,420
See accompanying notes to consolidated financial statements.
46