Hasbro 2010 Annual Report Download - page 77
Download and view the complete annual report
Please find page 77 of the 2010 Hasbro annual report below. You can navigate through the pages in the report by either clicking on the pages listed below, or by using the keyword search tool below to find specific information within the annual report.-
 1
1 -
2
-
3
-
4
-
5
-
6
-
7
-
8
-
9
-
10
-
11
-
12
-
13
-
14
-
15
-
16
-
17
-
18
-
19
-
20
-
21
-
22
-
23
-
24
-
25
-
26
-
27
-
28
-
29
-
30
-
31
-
32
-
33
-
34
-
35
-
36
-
37
-
38
-
39
-
40
-
41
-
42
-
43
-
44
-
45
-
46
-
47
-
48
-
49
-
50
-
51
-
52
-
53
-
54
-
55
-
56
-
57
-
58
-
59
-
60
-
61
-
62
-
63
-
64
-
65
-
66
-
 67
67 -
 68
68 -
 69
69 -
 70
70 -
 71
71 -
 72
72 -
 73
73 -
 74
74 -
 75
75 -
 76
76 -
 77
77 -
 78
78 -
 79
79 -
 80
80 -
 81
81 -
 82
82 -
 83
83 -
 84
84 -
 85
85 -
 86
86 -
 87
87 -
88
-
89
-
90
-
91
-
92
-
93
-
94
-
95
-
96
-
97
-
98
-
99
-
100
-
101
-
102
-
103
-
104
-
105
-
106
 |
 |

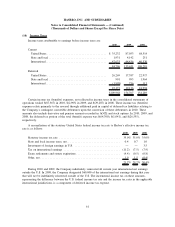
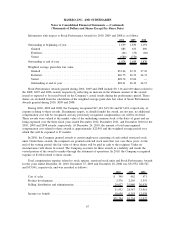
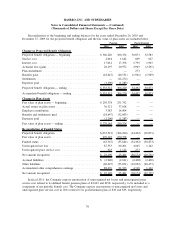
Information with respect to Stock Performance Awards for 2010, 2009 and 2008 is as follows:
2010 2009 2008
Outstanding at beginning of year . . . ............................ 1,639 1,830 1,194
Granted ............................................... 883 631 696
Forfeited ............................................... (64) (52) (60)
Vested ................................................ (580) (770) —
Outstanding at end of year ................................... 1,878 1,639 1,830
Weighted average grant-date fair value:
Granted ............................................... $33.44 22.31 27.10
Forfeited ............................................... $26.75 26.53 24.31
Vested ................................................ $28.74 19.06 —
Outstanding at end of year ................................. $28.61 26.22 24.15
Stock Performance Awards granted during 2010, 2009 and 2008 include 80, 116 and 100 shares related to
the 2008, 2007 and 2006 awards, respectively, reflecting an increase in the ultimate amount of the awards
issued or expected to be issued based on the Company’s actual results during the performance period. These
shares are excluded from the calculation of the weighted average grant-date fair value of Stock Performance
Awards granted during 2010, 2009 and 2008.
During 2010, 2009 and 2008, the Company recognized $17,144, $15,361 and $17,422, respectively, of
expense relating to these awards. If minimum targets, as detailed under the award, are not met, no additional
compensation cost will be recognized and any previously recognized compensation cost will be reversed.
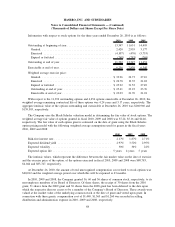
These awards were valued at the market value of the underlying common stock at the dates of grant and are
being expensed over the three fiscal years ended December 2012, December 2011, and December 2010 for the
2010, 2009 and 2008 awards, respectively. At December 26, 2010, the amount of total unrecognized
compensation cost related to these awards is approximately $22,901 and the weighted average period over
which this will be expensed is 27 months.
In 2010, the Company granted awards to certain employees consisting of cash settled restricted stock
units. Under these awards, the recipients are granted restricted stock units that vest over three years. At the
end of the vesting period, the fair value of those shares will be paid in cash to the recipient. Under no
circumstances will shares be issued. The Company accounts for these awards as a liability and marks the
vested portion of the award to market through the statement of operations. In 2010, the Company recognized
expense of $1,004 related to these awards.
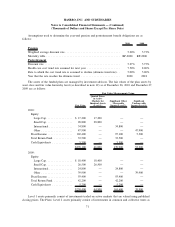
Total compensation expense related to stock options, restricted stock units and Stock Performance Awards
for the years ended December 26, 2010, December 27, 2009 and December 28, 2008 was $31,952, $28,547,
and $33,961, respectively, and was recorded as follows:
2010 2009 2008
Cost of sales ........................................... $ 349 462 471
Product development ..................................... 2,576 2,205 2,551
Selling, distribution and administration ....................... 29,027 25,880 30,939
31,952 28,547 33,961
Income tax benefit ...................................... 10,658 9,293 12,039
$21,294 19,254 21,922
67
HASBRO, INC. AND SUBSIDIARIES
Notes to Consolidated Financial Statements — (Continued)
(Thousands of Dollars and Shares Except Per Share Data)