Hasbro 2010 Annual Report Download - page 35
Download and view the complete annual report
Please find page 35 of the 2010 Hasbro annual report below. You can navigate through the pages in the report by either clicking on the pages listed below, or by using the keyword search tool below to find specific information within the annual report.-
 1
1 -
2
-
3
-
4
-
5
-
6
-
7
-
8
-
9
-
10
-
11
-
12
-
13
-
14
-
15
-
16
-
17
-
18
-
19
-
20
-
21
-
22
-
23
-
24
-
 25
25 -
 26
26 -
 27
27 -
 28
28 -
 29
29 -
 30
30 -
 31
31 -
 32
32 -
 33
33 -
 34
34 -
 35
35 -
 36
36 -
 37
37 -
 38
38 -
 39
39 -
 40
40 -
 41
41 -
 42
42 -
 43
43 -
 44
44 -
 45
45 -
46
-
47
-
48
-
49
-
50
-
51
-
52
-
53
-
54
-
55
-
56
-
57
-
58
-
59
-
60
-
61
-
62
-
63
-
64
-
65
-
66
-
67
-
68
-
69
-
70
-
71
-
72
-
73
-
74
-
75
-
76
-
77
-
78
-
79
-
80
-
81
-
82
-
83
-
84
-
85
-
86
-
87
-
88
-
89
-
90
-
91
-
92
-
93
-
94
-
95
-
96
-
97
-
98
-
99
-
100
-
101
-
102
-
103
-
104
-
105
-
106
 |
 |

the Company has improved its full year operating margin from 7.8% in 2002 to 14.7% in 2010. The Company
reviews its operations on an ongoing basis and seeks to reduce the cost structure of its underlying business and
promote efficiency.
The Company is committed to returning excess cash to its shareholders through share repurchases and
dividends. As part of this initiative, from 2005 to 2010, the Company’s Board of Directors (the “Board”)
adopted five successive share repurchase authorizations with a cumulative authorized repurchase amount of
$2,325,000. The fifth authorization was approved in April 2010 for $625,000. At December 26, 2010, the
Company had $150,068 remaining under the April 2010 authorization. In 2010, the Company invested
$636,681 in the repurchase of 15,763 shares of common stock in the open market. For the years ended 2009
and 2008, the Company spent $90,994 and $357,589, respectively, to repurchase 3,172 and 11,736 shares,
respectively, in the open market. The increased level of share repurchases in 2010 compared to 2009 partially
reflects the Company’s repurchase of an equivalent number of shares that were issued in 2010 in connection
with the call and related conversion of its convertible debt. The Company intends to, at its discretion,
opportunistically repurchase shares in the future subject to market conditions, the Company’s other potential
uses of cash and the Company’s levels of cash generation. In addition to the share repurchase program, the
Company also seeks to return excess cash through the payment of quarterly dividends. In February 2011, the
Company’s Board of Directors increased the Company’s quarterly dividend rate to $0.30 per share from $0.25
per share.
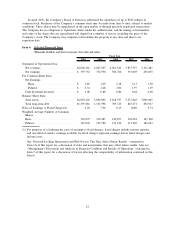
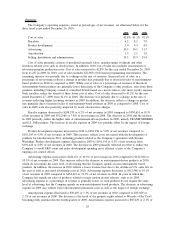
Summary
The components of the results of operations, stated as a percent of net revenues, are illustrated below for
the three fiscal years ended December 26, 2010.
2010 2009 2008
Net revenues .............................................. 100.0% 100.0% 100.0%
Costs and expenses:
Cost of sales .............................................. 42.8 41.2 42.1
Royalties ................................................. 6.2 8.1 7.8
Product development . . ...................................... 5.0 4.5 4.8
Advertising ............................................... 10.5 10.1 11.3
Amortization .............................................. 1.3 2.1 1.9
Selling, distribution and administration ........................... 19.5 19.5 19.8
Operating profit ............................................ 14.7 14.5 12.3
Interest expense ............................................ 2.1 1.5 1.2
Interest income............................................. (0.1) (0.1) (0.5)
Other (income) expense, net ................................... 0.1 0.1 0.6
Earnings before income taxes .................................. 12.6 13.0 11.0
Income taxes .............................................. 2.7 3.8 3.4
Net earnings ............................................... 9.9% 9.2% 7.6%
Results of Operations
Each of the fiscal years in the three-year period ended December 26, 2010 were fifty-two week periods.
Net earnings for the fiscal year ended December 26, 2010 were $397,752, or $2.74 per diluted share. This
compares to net earnings for fiscal 2009 and 2008 of $374,930 and $306,766, or $2.48 and $2.00 per diluted
share, respectively.
Net earnings for 2010 include a $0.15 per diluted share favorable impact resulting from the completion of
a U.S. tax examination for the 2004 and 2005 tax years. Net earnings for 2010 and 2009 include dilution from
25