Hasbro 2010 Annual Report Download - page 78
Download and view the complete annual report
Please find page 78 of the 2010 Hasbro annual report below. You can navigate through the pages in the report by either clicking on the pages listed below, or by using the keyword search tool below to find specific information within the annual report.-
 1
1 -
2
-
3
-
4
-
5
-
6
-
7
-
8
-
9
-
10
-
11
-
12
-
13
-
14
-
15
-
16
-
17
-
18
-
19
-
20
-
21
-
22
-
23
-
24
-
25
-
26
-
27
-
28
-
29
-
30
-
31
-
32
-
33
-
34
-
35
-
36
-
37
-
38
-
39
-
40
-
41
-
42
-
43
-
44
-
45
-
46
-
47
-
48
-
49
-
50
-
51
-
52
-
53
-
54
-
55
-
56
-
57
-
58
-
59
-
60
-
61
-
62
-
63
-
64
-
65
-
66
-
67
-
 68
68 -
 69
69 -
 70
70 -
 71
71 -
 72
72 -
 73
73 -
 74
74 -
 75
75 -
 76
76 -
 77
77 -
 78
78 -
 79
79 -
 80
80 -
 81
81 -
 82
82 -
 83
83 -
 84
84 -
 85
85 -
 86
86 -
 87
87 -
 88
88 -
89
-
90
-
91
-
92
-
93
-
94
-
95
-
96
-
97
-
98
-
99
-
100
-
101
-
102
-
103
-
104
-
105
-
106
 |
 |

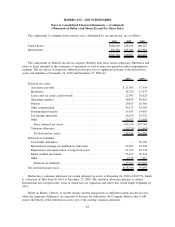
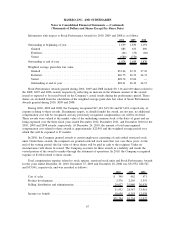
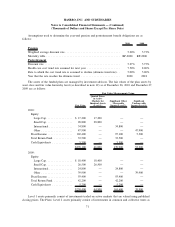
Information with respect to stock options for the three years ended December 26, 2010 is as follows:
2010 2009 2008
Outstanding at beginning of year ............................ 13,347 11,651 14,495
Granted ............................................. 2,420 2,955 3,177
Exercised ........................................... (4,107) (476) (5,753)
Expired or forfeited .................................... (268) (783) (268)
Outstanding at end of year................................. 11,392 13,347 11,651
Exercisable at end of year ................................. 6,256 7,839 6,345
Weighted average exercise price:
Granted ............................................. $ 33.96 22.73 27.10
Exercised ........................................... $ 22.78 19.35 21.02
Expired or forfeited .................................... $ 25.92 31.53 27.49
Outstanding at end of year ............................... $ 25.61 23.23 23.76
Exercisable at end of year ............................... $ 23.03 21.70 21.01
With respect to the 11,392 outstanding options and 6,256 options exercisable at December 26, 2010, the
weighted average remaining contractual life of these options was 4.24 years and 3.17 years, respectively. The
aggregate intrinsic value of the options outstanding and exercisable at December 26, 2010 was $260,960 and
$159,503, respectively.
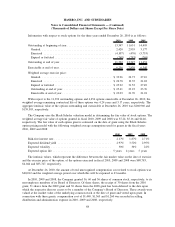
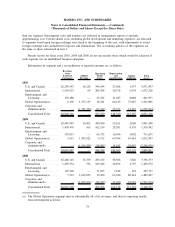
The Company uses the Black-Scholes valuation model in determining the fair value of stock options. The
weighted average fair value of options granted in fiscal 2010, 2009 and 2008 was $7.24, $5.16 and $4.46,
respectively. The fair value of each option grant is estimated on the date of grant using the Black-Scholes
option pricing model with the following weighted average assumptions used for grants in the fiscal years
2010, 2009 and 2008:
2010 2009 2008
Risk-free interest rate .................................... 2.17% 1.87% 2.71%
Expected dividend yield .................................. 2.97% 3.52% 2.95%
Expected volatility ...................................... 30% 36% 22%
Expected option life ..................................... 5years 4 years 5 years
The intrinsic values, which represent the difference between the fair market value on the date of exercise
and the exercise price of the option, of the options exercised in fiscal 2010, 2009 and 2008 were $80,783,
$4,044 and $83,747, respectively.
At December 26, 2010, the amount of total unrecognized compensation cost related to stock options was
$20,012 and the weighted average period over which this will be expensed is 23 months.
In 2010, 2009 and 2008, the Company granted 36, 60 and 36 shares of common stock, respectively, to its
non-employee members of its Board of Directors. Of these shares, the receipt of 30 shares from the 2010
grant, 51 shares from the 2009 grant and 30 shares from the 2008 grant has been deferred to the date upon
which the respective director ceases to be a member of the Company’s Board of Directors. These awards were
valued at the market value of the underlying common stock at the date of grant and vested upon grant. In
connection with these grants, compensation cost of $1,440, $1,365 and $1,260 was recorded in selling,
distribution and administration expense in 2010, 2009 and 2008, respectively.
68
HASBRO, INC. AND SUBSIDIARIES
Notes to Consolidated Financial Statements — (Continued)
(Thousands of Dollars and Shares Except Per Share Data)