Hasbro 2010 Annual Report Download - page 41
Download and view the complete annual report
Please find page 41 of the 2010 Hasbro annual report below. You can navigate through the pages in the report by either clicking on the pages listed below, or by using the keyword search tool below to find specific information within the annual report.-
 1
1 -
2
-
3
-
4
-
5
-
6
-
7
-
8
-
9
-
10
-
11
-
12
-
13
-
14
-
15
-
16
-
17
-
18
-
19
-
20
-
21
-
22
-
23
-
24
-
25
-
26
-
27
-
28
-
29
-
30
-
 31
31 -
 32
32 -
 33
33 -
 34
34 -
 35
35 -
 36
36 -
 37
37 -
 38
38 -
 39
39 -
 40
40 -
 41
41 -
 42
42 -
 43
43 -
 44
44 -
 45
45 -
 46
46 -
 47
47 -
 48
48 -
 49
49 -
 50
50 -
 51
51 -
52
-
53
-
54
-
55
-
56
-
57
-
58
-
59
-
60
-
61
-
62
-
63
-
64
-
65
-
66
-
67
-
68
-
69
-
70
-
71
-
72
-
73
-
74
-
75
-
76
-
77
-
78
-
79
-
80
-
81
-
82
-
83
-
84
-
85
-
86
-
87
-
88
-
89
-
90
-
91
-
92
-
93
-
94
-
95
-
96
-
97
-
98
-
99
-
100
-
101
-
102
-
103
-
104
-
105
-
106
 |
 |

Other (income) expense, net of $156 in 2009 compared to $23,752 in 2008. Other (income) expense, net
in 2009 included income of $(3,856) representing the Company’s 50% share in the earnings of THE HUB.
The remainder of the change in other (income) expense in 2009 as compared to 2008 primarily reflected the
impact of foreign exchange gains and losses.
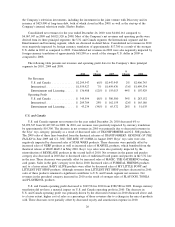
Income Taxes
Income tax expense totaled 21.7% of pretax earnings in 2010 compared with 29.2% in 2009 and 30.4%
in 2008. Income tax expense for 2010 is net of a benefit of approximately $22,300 from discrete tax events,
primarily related to the settlement of various tax examinations in multiple jurisdictions, including the
United States. Income tax expense for 2009 is net of a benefit of approximately $2,300 from discrete tax
events, primarily related to the expiration of state statutes and settlement of various tax examinations in
multiple jurisdictions. Income tax expense for 2008 is net of a benefit of approximately $10,200 related to
discrete tax events, primarily comprised of a benefit from the repatriation of certain foreign earnings, as well
as the settlement of various tax examinations in multiple jurisdictions. Absent these items and potential interest
and penalties related to uncertain tax positions in 2010, 2009 and 2008, the effective tax rates would have
been 25.4%, 29.0% and 32.8%, respectively. The decrease in the adjusted tax rate from 29.0% in 2009
compared to 25.4% in 2010 is primarily due to a change in the mix of where the company earned its profits,
due to lower earnings in the U.S. and increased earnings in international jurisdictions in which the tax rates
are lower. The adjusted tax rate of 32.8% in 2008 primarily reflects the decision to provide for the repatriation
of a portion of 2008 international earnings to the U.S.
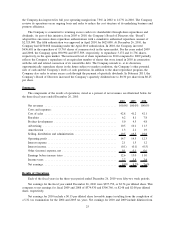
Liquidity and Capital Resources
The Company has historically generated a significant amount of cash from operations. In 2010, the
Company funded its operations and liquidity needs primarily through cash flows from operations, and, when
needed, using borrowings under its available lines of credit. In addition, in January 2011, the Company entered
into an agreement with a group of banks to establish a commercial paper program. Under the program, at the
Company’s request and subject to market conditions, the group of banks may either purchase or arrange for
the sale by the Company of unsecured commercial paper notes from time to time up to an aggregate principal
amount outstanding at any given time of $500,000. During 2011, the Company expects to continue to fund its
working capital needs primarily through cash flows from operations and, when needed, by issuing commercial
paper or borrowing under its new revolving credit agreement. In the event that the Company is not able to
issue commercial paper, the Company intends to utilize its available lines of credit. The Company believes
that the funds available to it, including cash expected to be generated from operations and funds available
through its commercial paper program or its available lines of credit are adequate to meet its working capital
needs for 2011, however, unexpected events or circumstances such as material operating losses or increased
capital or other expenditures, or inability to otherwise access the commercial paper market, may reduce or
eliminate the availability of external financial resources. In addition, significant disruptions to credit markets
may also reduce or eliminate the availability of external financial resources. Although we believe the risk of
nonperformance by the counterparties to our financial facilities is not significant, in times of severe economic
downturn in the credit markets it is possible that one or more sources of external financing may be unable or
unwilling to provide funding to us.
At December 26, 2010, cash and cash equivalents, net of short-term borrowings, were $713,228 compared
to $621,932 and $622,804 at December 27, 2009 and December 28, 2008, respectively. Hasbro generated
$367,981, $265,623 and $593,185 of cash from its operating activities in 2010, 2009 and 2008, respectively.
Cash from operations in 2010 and 2009 includes long-term royalty advance payments of $25,000 and $75,000,
respectively. There were no long-term advance royalty payments made in 2008. Operating cash flows in 2009
were also negatively impacted by the Company’s decision to sell $250,000 of its accounts receivable under its
securitization program at December 28, 2008. The securitization program was not utilized at December 26,
2010 or December 27, 2009. The Company did not renew its accounts receivable securitization facility when
that facility came up for renewal in January 2011.
31