Hasbro 2010 Annual Report Download - page 63
Download and view the complete annual report
Please find page 63 of the 2010 Hasbro annual report below. You can navigate through the pages in the report by either clicking on the pages listed below, or by using the keyword search tool below to find specific information within the annual report.-
 1
1 -
2
-
3
-
4
-
5
-
6
-
7
-
8
-
9
-
10
-
11
-
12
-
13
-
14
-
15
-
16
-
17
-
18
-
19
-
20
-
21
-
22
-
23
-
24
-
25
-
26
-
27
-
28
-
29
-
30
-
31
-
32
-
33
-
34
-
35
-
36
-
37
-
38
-
39
-
40
-
41
-
42
-
43
-
44
-
45
-
46
-
47
-
48
-
49
-
50
-
51
-
52
-
 53
53 -
 54
54 -
 55
55 -
 56
56 -
 57
57 -
 58
58 -
 59
59 -
 60
60 -
 61
61 -
 62
62 -
 63
63 -
 64
64 -
 65
65 -
 66
66 -
 67
67 -
 68
68 -
 69
69 -
 70
70 -
 71
71 -
 72
72 -
 73
73 -
74
-
75
-
76
-
77
-
78
-
79
-
80
-
81
-
82
-
83
-
84
-
85
-
86
-
87
-
88
-
89
-
90
-
91
-
92
-
93
-
94
-
95
-
96
-
97
-
98
-
99
-
100
-
101
-
102
-
103
-
104
-
105
-
106
 |
 |

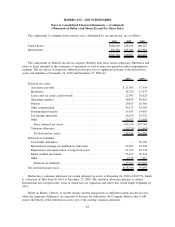
amounts related to dilutive securities. Dilutive securities include shares issuable under convertible debt, as well
as shares issuable upon exercise of stock options and warrants for which the market price exceeds the exercise
price, less shares which could have been purchased by the Company with the related proceeds. Options
totaling 94, 5,784 and 3,491 for 2010, 2009 and 2008, respectively, were excluded from the calculation of
diluted earnings per share because to include them would have been antidilutive.
A reconciliation of net earnings and average number of shares for each of the three fiscal years ended
December 26, 2010 is as follows:
Basic Diluted Basic Diluted Basic Diluted
2010 2009 2008
Net earnings .............. $397,752 397,752 374,930 374,930 306,766 306,766
Interest expense on
contingent convertible
debentures due 2021, net
oftax................ — 1,124 — 4,328 — 4,238
Adjusted net earnings ........ $397,752 398,876 374,930 379,258 306,766 311,004
Average shares outstanding.... 139,079 139,079 139,487 139,487 140,877 140,877
Effect of dilutive securities:
Contingent convertible
debentures due 2021 ..... — 3,024 — 11,566 — 11,566
Options, warrants, and other
share-based awards ...... — 3,567 — 1,727 — 2,787
Equivalent shares ........... 139,079 145,670 139,487 152,780 140,877 155,230
Net earnings per share ....... $ 2.86 2.74 2.69 2.48 2.18 2.00
The net earnings per share calculations for each of the three years ended December 26, 2010 include
adjustments to add back to earnings the interest expense, net of tax, incurred on the Company’s senior
convertible debentures due 2021, as well as to add back to outstanding shares the amount of shares potentially
issuable under the contingent conversion feature of these debentures. During the first and second quarter of
2010, substantially all of these debentures were converted into shares of common stock. See note 9 for further
information.
53
HASBRO, INC. AND SUBSIDIARIES
Notes to Consolidated Financial Statements — (Continued)
(Thousands of Dollars and Shares Except Per Share Data)