GameStop 2011 Annual Report Download - page 90
Download and view the complete annual report
Please find page 90 of the 2011 GameStop annual report below. You can navigate through the pages in the report by either clicking on the pages listed below, or by using the keyword search tool below to find specific information within the annual report.-
 1
1 -
2
-
3
-
4
-
5
-
6
-
7
-
8
-
9
-
10
-
11
-
12
-
13
-
14
-
15
-
16
-
17
-
18
-
19
-
20
-
21
-
22
-
23
-
24
-
25
-
26
-
27
-
28
-
29
-
30
-
31
-
32
-
33
-
34
-
35
-
36
-
37
-
38
-
39
-
40
-
41
-
42
-
43
-
44
-
45
-
46
-
47
-
48
-
49
-
50
-
51
-
52
-
53
-
54
-
55
-
56
-
57
-
58
-
59
-
60
-
61
-
62
-
63
-
64
-
65
-
66
-
67
-
68
-
69
-
70
-
71
-
72
-
73
-
74
-
75
-
76
-
77
-
78
-
79
-
 80
80 -
 81
81 -
 82
82 -
 83
83 -
 84
84 -
 85
85 -
 86
86 -
 87
87 -
 88
88 -
 89
89 -
 90
90 -
 91
91 -
 92
92 -
 93
93 -
 94
94 -
 95
95 -
 96
96 -
 97
97 -
 98
98 -
 99
99 -
 100
100 -
101
-
102
-
103
-
104
-
105
-
106
-
107
-
108
-
109
-
110
-
111
-
112
-
113
-
114
-
115
-
116
 |
 |
GAMESTOP CORP.
NOTES TO CONSOLIDATED FINANCIAL STATEMENTS — (Continued)
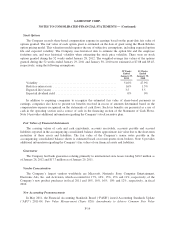
The Company’s accrual for termination benefits and facility closure and other costs was recorded as a
current liability within accrued liabilities on its consolidated balance sheet as of January 28, 2012 in the amount
of $9.5 million. No amounts have been paid related to this liability as of January 28, 2012.
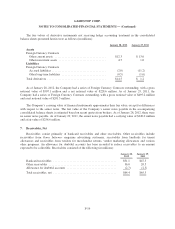
The Company also recognized impairment charges in fiscal 2010 and fiscal 2009 of $1.5 million and $1.8
million, respectively, related to its annual evaluation of store property, equipment and other assets in situations
where the asset’s carrying value was not expected to be recovered by its future cash flows over its remaining
useful life. These charges were primarily related to the Company’s stores in the European segment.
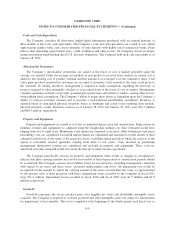
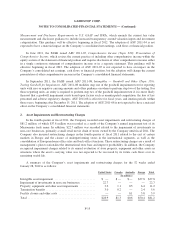
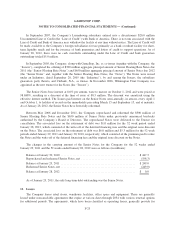
3. Acquisitions
During fiscal 2011, the Company completed acquisitions with a total consideration of $30.1 million, with
the excess of the purchase price over the net assets acquired, in the amount of $26.9 million recorded as
goodwill. During fiscal 2010 and fiscal 2009, the Company completed acquisitions with a total consideration of
$38.1 million and $8.4 million, respectively, with the excess of the purchase price over the net assets acquired, in
the amount of $28.5 million and $4.2 million, respectively, recorded as goodwill. The Company included the
results of operations of the acquisitions, which were not material, in the financial statements beginning on the
closing date of each respective acquisition. The pro forma effect assuming these acquisitions were made at the
beginning of each fiscal year is not material to the Company’s consolidated financial statements. Note 9 provides
additional information concerning goodwill and intangible assets.
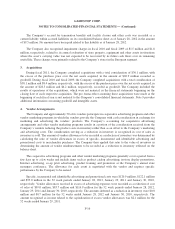
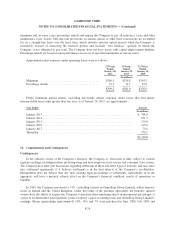
4. Vendor Arrangements
The Company and approximately 50 of its vendors participate in cooperative advertising programs and other
vendor marketing programs in which the vendors provide the Company with cash consideration in exchange for
marketing and advertising the vendors’ products. The Company’s accounting for cooperative advertising
arrangements and other vendor marketing programs results in a portion of the consideration received from the
Company’s vendors reducing the product costs in inventory rather than as an offset to the Company’s marketing
and advertising costs. The consideration serving as a reduction in inventory is recognized in cost of sales as
inventory is sold. The amount of vendor allowances to be recorded as a reduction of inventory was determined by
calculating the ratio of vendor allowances in excess of specific, incremental and identifiable advertising and
promotional costs to merchandise purchases. The Company then applied this ratio to the value of inventory in
determining the amount of vendor reimbursements to be recorded as a reduction to inventory reflected on the
balance sheet.
The cooperative advertising programs and other vendor marketing programs generally cover a period from a
few days up to a few weeks and include items such as product catalog advertising, in-store display promotions,
Internet advertising, co-op print advertising, product training and promotion at the Company’s annual store
managers conference. The allowance for each event is negotiated with the vendor and requires specific
performance by the Company to be earned.
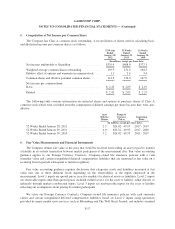
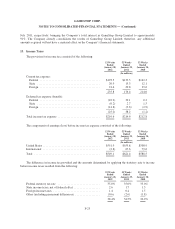
Specific, incremental and identifiable advertising and promotional costs were $120.9 million, $122.1 million
and $93.0 million in the 52 week periods ended January 28, 2012, January 29, 2011 and January 30, 2010,
respectively. Vendor allowances received in excess of advertising expenses were recorded as a reduction of cost
of sales of $99.0 million, $83.7 million and $116.9 million for the 52 week periods ended January 28, 2012,
January 29, 2011 and January 30, 2010, respectively. The amounts deferred as a reduction in inventory were $0.8
million and $0.7 million for the 52 weeks ended January 28, 2012 and January 30, 2010, respectively. The
amount recognized as income related to the capitalization of excess vendor allowances was $2.1 million for the
52 weeks ended January 29, 2011.
F-16