GameStop 2011 Annual Report Download - page 55
Download and view the complete annual report
Please find page 55 of the 2011 GameStop annual report below. You can navigate through the pages in the report by either clicking on the pages listed below, or by using the keyword search tool below to find specific information within the annual report.-
 1
1 -
2
-
3
-
4
-
5
-
6
-
7
-
8
-
9
-
10
-
11
-
12
-
13
-
14
-
15
-
16
-
17
-
18
-
19
-
20
-
21
-
22
-
23
-
24
-
25
-
26
-
27
-
28
-
29
-
30
-
31
-
32
-
33
-
34
-
35
-
36
-
37
-
38
-
39
-
40
-
41
-
42
-
43
-
44
-
 45
45 -
 46
46 -
 47
47 -
 48
48 -
 49
49 -
 50
50 -
 51
51 -
 52
52 -
 53
53 -
 54
54 -
 55
55 -
 56
56 -
 57
57 -
 58
58 -
 59
59 -
 60
60 -
 61
61 -
 62
62 -
 63
63 -
 64
64 -
 65
65 -
66
-
67
-
68
-
69
-
70
-
71
-
72
-
73
-
74
-
75
-
76
-
77
-
78
-
79
-
80
-
81
-
82
-
83
-
84
-
85
-
86
-
87
-
88
-
89
-
90
-
91
-
92
-
93
-
94
-
95
-
96
-
97
-
98
-
99
-
100
-
101
-
102
-
103
-
104
-
105
-
106
-
107
-
108
-
109
-
110
-
111
-
112
-
113
-
114
-
115
-
116
 |
 |
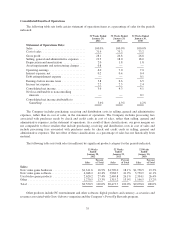
Selling, general and administrative expenses increased by $65.5 million, or 4.0%, from $1,633.3 million in
fiscal 2009 to $1,698.8 million in fiscal 2010. The increase was primarily attributable to the increase in the
number of stores in operation and the related increases in store, distribution and corporate office operating
expenses, as well as expenses incurred in our digital and loyalty initiatives in fiscal 2010. Selling, general and
administrative expenses as a percentage of sales were 18.0% in fiscal 2009 and fiscal 2010. Selling, general and
administrative expenses include $29.6 million and $37.8 million in stock-based compensation expense for fiscal
2010 and fiscal 2009, respectively. Foreign currency transaction gains and (losses) are included in selling,
general and administrative expenses and amounted to $2.5 million in fiscal 2010, compared to $3.8 million in
fiscal 2009.
Asset impairment and restructuring charges of $1.5 million and $1.8 million in fiscal 2010 and fiscal 2009,
respectively, relate to impairment of assets at underperforming stores.
Depreciation and amortization expense increased $12.1 million from $162.6 million in fiscal 2009 to
$174.7 million in fiscal 2010. This increase was primarily due to capital expenditures associated with the opening
of 359 new stores during fiscal 2010 and investments in strategic initiatives and management information
systems. Depreciation and amortization expense is expected to increase from fiscal 2010 to fiscal 2011 due to
continued investments in new stores, management information systems and other strategic initiatives.
Interest income resulting from the investment of excess cash balances decreased from $2.2 million in fiscal
2009 to $1.8 million in fiscal 2010 as a result of lower invested cash balances and lower interest rates during
fiscal 2010. Interest expense decreased from $45.4 million in fiscal 2009 to $37.0 million in fiscal 2010,
primarily due to the retirement of $200.0 million of the Company’s senior notes since January 30, 2010 and the
retirement of $100.0 million of the Company’s senior notes during fiscal 2009. Debt extinguishment expense of
$6.0 million and $5.3 million was recognized in fiscal 2010 and fiscal 2009, respectively, as a result of the
premiums paid related to debt retirement and the recognition of deferred financing fees and unamortized original
issue discount.
Income tax expense increased by $1.8 million, from $212.8 million in fiscal 2009 to $214.6 million in fiscal
2010. The Company’s effective tax rate decreased from 36.2% in fiscal 2009 to 34.5% in fiscal 2010 due
primarily to the variability in the accounting for the Company’s uncertain tax positions. See Note 13 of “Notes to
Consolidated Financial Statements” for additional information regarding income taxes.
The factors described above led to an increase in operating earnings of $25.6 million, or 4.0%, from
$637.0 million in fiscal 2009 to $662.6 million in fiscal 2010 and an increase in consolidated net income of
$31.1 million, or 8.3%, from $375.7 million in fiscal 2009 to $406.8 million in fiscal 2010.
The $1.2 million and $1.6 million net loss attributable to noncontrolling interests for fiscal 2010 and fiscal
2009, respectively, represents the portion of the minority interest stockholders’ net loss of the Company’s
non-wholly owned subsidiaries included in the Company’s consolidated net income.
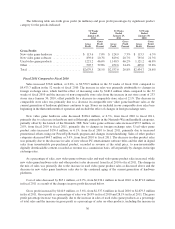
Segment Performance
The Company operates its business in the following segments: United States, Canada, Australia and Europe.
We identified these segments based on a combination of geographic areas, the methods with which we analyze
performance, the way in which our sales and profits are derived and how we divide management responsibility.
Our sales and profits are driven through our physical stores which are highly integrated with our e-commerce,
digital and mobile businesses. Due to this integration, our physical stores are the basis for our segment reporting.
Each of the segments consists primarily of retail operations, with all stores engaged in the sale of new and used
video game systems, software and accessories (which we refer to as video game products) and PC entertainment
software and related accessories. These products are substantially the same regardless of geographic location,
39