GameStop 2011 Annual Report Download - page 44
Download and view the complete annual report
Please find page 44 of the 2011 GameStop annual report below. You can navigate through the pages in the report by either clicking on the pages listed below, or by using the keyword search tool below to find specific information within the annual report.-
 1
1 -
2
-
3
-
4
-
5
-
6
-
7
-
8
-
9
-
10
-
11
-
12
-
13
-
14
-
15
-
16
-
17
-
18
-
19
-
20
-
21
-
22
-
23
-
24
-
25
-
26
-
27
-
28
-
29
-
30
-
31
-
32
-
33
-
 34
34 -
 35
35 -
 36
36 -
 37
37 -
 38
38 -
 39
39 -
 40
40 -
 41
41 -
 42
42 -
 43
43 -
 44
44 -
 45
45 -
 46
46 -
 47
47 -
 48
48 -
 49
49 -
 50
50 -
 51
51 -
 52
52 -
 53
53 -
 54
54 -
55
-
56
-
57
-
58
-
59
-
60
-
61
-
62
-
63
-
64
-
65
-
66
-
67
-
68
-
69
-
70
-
71
-
72
-
73
-
74
-
75
-
76
-
77
-
78
-
79
-
80
-
81
-
82
-
83
-
84
-
85
-
86
-
87
-
88
-
89
-
90
-
91
-
92
-
93
-
94
-
95
-
96
-
97
-
98
-
99
-
100
-
101
-
102
-
103
-
104
-
105
-
106
-
107
-
108
-
109
-
110
-
111
-
112
-
113
-
114
-
115
-
116
 |
 |

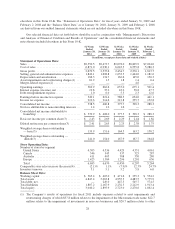
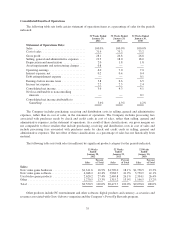
elsewhere in this Form 10-K. The “Statement of Operations Data” for fiscal years ended January 31, 2009 and
February 2, 2008 and the “Balance Sheet Data” as of January 30, 2010, January 31, 2009 and February 2, 2008
are derived from our audited financial statements which are not included elsewhere in this Form 10-K.
Our selected financial data set forth below should be read in conjunction with “Management’s Discussion
and Analysis of Financial Condition and Results of Operations” and the consolidated financial statements and
notes thereto included elsewhere in this Form 10-K.
52 Weeks
Ended
January 28,
2012
52 Weeks
Ended
January 29,
2011
52 Weeks
Ended
January 30,
2010
52 Weeks
Ended
January 31,
2009
52 Weeks
Ended
February 2,
2008
(In millions, except per share data and statistical data)
Statement of Operations Data:
Sales .................................... $9,550.5 $9,473.7 $9,078.0 $8,805.9 $7,094.0
Cost of sales .............................. 6,871.0 6,936.1 6,643.3 6,535.8 5,280.3
Gross profit ............................... 2,679.5 2,537.6 2,434.7 2,270.1 1,813.7
Selling, general and administrative expenses ..... 1,842.1 1,698.8 1,633.3 1,444.0 1,181.6
Depreciation and amortization ................ 186.3 174.7 162.6 145.0 130.3
Asset impairments and restructuring charges(1) . . .
81.2 1.5 1.8 1.4 0.4
Merger-related expenses(2) .................. — — — 4.6 —
Operating earnings ......................... 569.9 662.6 637.0 675.1 501.4
Interest expense (income), net ................ 19.8 35.2 43.2 38.8 47.7
Debt extinguishment expense ................. 1.0 6.0 5.3 2.3 12.6
Earnings before income tax expense ........... 549.1 621.4 588.5 634.0 441.1
Income tax expense ........................ 210.6 214.6 212.8 235.7 152.8
Consolidated net income .................... 338.5 406.8 375.7 398.3 288.3
Net loss attributable to noncontrolling interests . . . 1.4 1.2 1.6 — —
Consolidated net income attributable to
GameStop .............................. $ 339.9 $ 408.0 $ 377.3 $ 398.3 $ 288.3
Basic net income per common share(3) ......... $ 2.43 $ 2.69 $ 2.29 $ 2.44 $ 1.82
Diluted net income per common share(3) ....... $ 2.41 $ 2.65 $ 2.25 $ 2.38 $ 1.75
Weighted average shares outstanding
— basic(3) ............................. 139.9 151.6 164.5 163.2 158.2
Weighted average shares outstanding —
diluted(3) .............................. 141.0 154.0 167.9 167.7 164.8
Store Operating Data:
Number of stores by segment
United States ............................ 4,503 4,536 4,429 4,331 4,061
Canada ................................ 346 345 337 325 287
Australia ............................... 411 405 388 350 280
Europe ................................ 1,423 1,384 1,296 1,201 636
Total .................................. 6,683 6,670 6,450 6,207 5,264
Comparable store sales increase (decrease)(4) .... (2.1)% 1.1% (7.9)% 12.3% 24.7%
Inventory turnover ......................... 5.1 5.1 5.2 5.8 6.0
Balance Sheet Data:
Working capital ........................... $ 363.4 $ 407.0 $ 471.6 $ 255.3 $ 534.2
Total assets ............................... 4,847.4 5,063.8 4,955.3 4,483.5 3,775.9
Total debt, net ............................. — 249.0 447.3 545.7 574.5
Total liabilities ............................ 1,807.2 2,167.9 2,232.3 2,212.9 1,913.4
Total equity ............................... 3,040.2 2,895.9 2,723.0 2,270.6 1,862.4
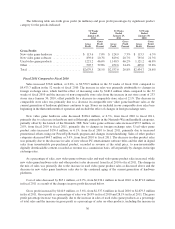
(1) The Company’s results of operations for fiscal 2011 include expenses related to asset impairments and
restructuring charges of which $37.8 million relates to the impairment of the Micromania trade name, $22.7
million relates to the impairment of investments in non-core businesses and $20.7 million relates to other
28