GameStop 2011 Annual Report Download - page 54
Download and view the complete annual report
Please find page 54 of the 2011 GameStop annual report below. You can navigate through the pages in the report by either clicking on the pages listed below, or by using the keyword search tool below to find specific information within the annual report.-
 1
1 -
2
-
3
-
4
-
5
-
6
-
7
-
8
-
9
-
10
-
11
-
12
-
13
-
14
-
15
-
16
-
17
-
18
-
19
-
20
-
21
-
22
-
23
-
24
-
25
-
26
-
27
-
28
-
29
-
30
-
31
-
32
-
33
-
34
-
35
-
36
-
37
-
38
-
39
-
40
-
41
-
42
-
43
-
 44
44 -
 45
45 -
 46
46 -
 47
47 -
 48
48 -
 49
49 -
 50
50 -
 51
51 -
 52
52 -
 53
53 -
 54
54 -
 55
55 -
 56
56 -
 57
57 -
 58
58 -
 59
59 -
 60
60 -
 61
61 -
 62
62 -
 63
63 -
 64
64 -
65
-
66
-
67
-
68
-
69
-
70
-
71
-
72
-
73
-
74
-
75
-
76
-
77
-
78
-
79
-
80
-
81
-
82
-
83
-
84
-
85
-
86
-
87
-
88
-
89
-
90
-
91
-
92
-
93
-
94
-
95
-
96
-
97
-
98
-
99
-
100
-
101
-
102
-
103
-
104
-
105
-
106
-
107
-
108
-
109
-
110
-
111
-
112
-
113
-
114
-
115
-
116
 |
 |
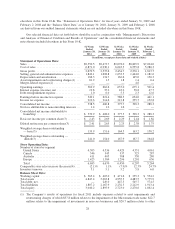
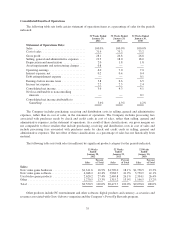
The $1.4 million and $1.2 million net loss attributable to noncontrolling interests for fiscal 2011 and fiscal
2010, respectively, represents the portion of the minority interest stockholders’ net loss of the Company’s
non-wholly owned subsidiaries included in the Company’s consolidated net income.
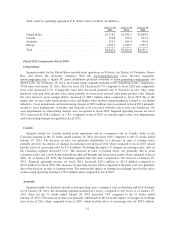
Fiscal 2010 Compared to Fiscal 2009
Sales increased $395.7 million, or 4.4%, to $9,473.7 million in the 52 weeks of fiscal 2010 compared to
$9,078.0 million in the 52 weeks of fiscal 2009. The increase in sales was primarily attributable to the addition of
non-comparable store sales from the 747 stores opened since January 31, 2009, and an increase in comparable
store sales of 1.1%. The increase in comparable store sales was primarily due to strong sales of new video game
and PC entertainment titles in fiscal 2010 compared to fiscal 2009.
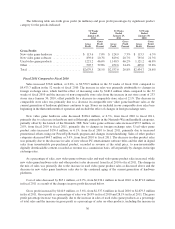
New video game hardware sales decreased $36.5 million, or 2.1%, from fiscal 2009 to fiscal 2010, primarily
due to a decrease in hardware unit sell-through, primarily in the Nintendo Wii and DSi and Sony PSP, and price
cuts which resulted in lower per unit sales, partially offset by the additional sales at new stores added since fiscal
2009. New video game hardware sales decreased as a percentage of sales from 19.3% in fiscal 2009 to 18.1% in
fiscal 2010, primarily due to the slow-down in hardware unit sell-through as the new platforms mature, as well as
price decreases initiated by the manufacturers in fiscal 2009.
New video game software sales increased $237.8 million, or 6.4%, from fiscal 2009 to fiscal 2010, primarily
due to strong sales of new video game titles released in fiscal 2010, compared to fiscal 2009, as well as sales
from new stores added since fiscal 2009. New video game software sales increased as a percentage of total sales
from 41.1% in fiscal 2009 to 41.9% in fiscal 2010, primarily due to the new release sales growth and the slow-
down in hardware unit sell-through discussed above.
Used video game product sales increased $75.7 million, or 3.2%, from fiscal 2009 to fiscal 2010, primarily
due to the increase in the availability of hardware and software associated with the current generation hardware
platforms as those platforms age and expand and the additional sales at new stores added since fiscal 2009. As a
percentage of sales, used video game product sales decreased from 26.4% to 26.1%, primarily due to the increase
in new release video game software sales and other product sales. Sales of other product categories, including PC
entertainment and other software and accessories, increased 9.9%, or $118.7 million, from fiscal 2009 to fiscal
2010, primarily due to stronger sales of newly-released PC entertainment software titles in fiscal 2010 and an
increase in revenue associated with the Company’s loyalty program.
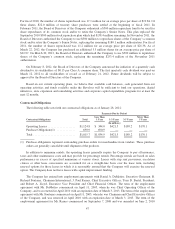
Cost of sales increased by $292.8 million, or 4.4%, from $6,643.3 million in fiscal 2009 to $6,936.1 million
in fiscal 2010 as a result of the increase in sales and the changes in gross profit discussed below.
Gross profit increased by $102.9 million, or 4.2%, from $2,434.7 million in fiscal 2009 to $2,537.6 million
in fiscal 2010. Gross profit as a percentage of sales was 26.8% in fiscal 2009 and fiscal 2010. Gross profit as a
percentage of sales on new video game hardware increased from 6.5% in fiscal 2009 to 7.3% in fiscal 2010 due
primarily to an increase in product replacement plan sales. Gross profit as a percentage of sales on new video
game software decreased from 21.3% in fiscal 2009 to 20.7% in fiscal 2010, primarily due to a decrease in
vendor allowances received, net of advertising expenses. Advertising expenses increased, due in part to expenses
associated with the Company’s new loyalty program. Gross profit as a percentage of sales on used video game
products decreased from 46.8% in fiscal 2009 to 46.2% in fiscal 2010 primarily due to promotional activities in
the holiday selling season and a shift in sales from older hardware and software platform sales, which generate
higher gross margins as platforms age, to current generation platform sales which have lower gross margins.
Gross profit as a percentage of sales on the other product sales category increased from 33.8% in fiscal 2009 to
34.4% in fiscal 2010 primarily due to a shift in sales to higher margin accessories, increases in revenue
associated with the Company’s loyalty program and the increase in sales of digital online game cards, some of
which are recorded on a commission basis at 100% margin.
38