GameStop 2011 Annual Report Download - page 45
Download and view the complete annual report
Please find page 45 of the 2011 GameStop annual report below. You can navigate through the pages in the report by either clicking on the pages listed below, or by using the keyword search tool below to find specific information within the annual report.-
 1
1 -
2
-
3
-
4
-
5
-
6
-
7
-
8
-
9
-
10
-
11
-
12
-
13
-
14
-
15
-
16
-
17
-
18
-
19
-
20
-
21
-
22
-
23
-
24
-
25
-
26
-
27
-
28
-
29
-
30
-
31
-
32
-
33
-
34
-
 35
35 -
 36
36 -
 37
37 -
 38
38 -
 39
39 -
 40
40 -
 41
41 -
 42
42 -
 43
43 -
 44
44 -
 45
45 -
 46
46 -
 47
47 -
 48
48 -
 49
49 -
 50
50 -
 51
51 -
 52
52 -
 53
53 -
 54
54 -
 55
55 -
56
-
57
-
58
-
59
-
60
-
61
-
62
-
63
-
64
-
65
-
66
-
67
-
68
-
69
-
70
-
71
-
72
-
73
-
74
-
75
-
76
-
77
-
78
-
79
-
80
-
81
-
82
-
83
-
84
-
85
-
86
-
87
-
88
-
89
-
90
-
91
-
92
-
93
-
94
-
95
-
96
-
97
-
98
-
99
-
100
-
101
-
102
-
103
-
104
-
105
-
106
-
107
-
108
-
109
-
110
-
111
-
112
-
113
-
114
-
115
-
116
 |
 |

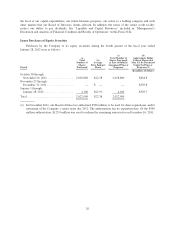
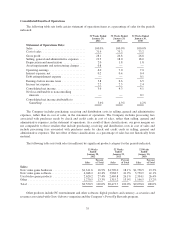
impairments, termination benefits and facility closure costs. For fiscal years 2007 through 2010, the asset
impairments and restructuring charges are related to the impairment charges from the annual evaluation of
store property, equipment and other assets.
(2) The Company’s results of operations for the 52 weeks ended January 31, 2009 include expenses of $4.6
million which were of a one-time or short-term nature associated with the Micromania acquisition, of which
$3.5 million related to foreign currency losses on funds used to purchase Micromania.
(3) Weighted average shares outstanding and earnings per common share have been adjusted to reflect the
conversion of Class B common stock that was outstanding prior to its conversion into Class A common
stock on a one-for-one basis on February 7, 2007 and a two-for-one stock split on March 16, 2007. The
Company’s Class B common stock was traded on the NYSE under the symbol “GME.B” until February 7,
2007.
(4) Stores are included in our comparable store sales base beginning in the 13th month of operation.
Item 7. Management’s Discussion and Analysis of Financial Condition and Results of Operations
The following discussion should be read in conjunction with the information contained in our consolidated
financial statements, including the notes thereto. Statements regarding future economic performance,
management’s plans and objectives, and any statements concerning assumptions related to the foregoing
contained in Management’s Discussion and Analysis of Financial Condition and Results of Operations constitute
forward-looking statements. Certain factors, which may cause actual results to vary materially from these
forward-looking statements, accompany such statements or appear elsewhere in this Form 10-K, including the
factors disclosed under “Item 1A. — Risk Factors.”
General
GameStop Corp. (together with its predecessor companies, “GameStop,” “we,” “us,” “our,” or the
“Company”) is the world’s largest multichannel video game retailer. We sell new and used video game hardware,
physical and digital video game software, accessories, as well as PC entertainment software and other
merchandise primarily through our GameStop, EB Games and Micromania stores. As of January 28, 2012, we
operated 6,683 stores, in the United States, Australia, Canada and Europe, which are primarily located in major
shopping malls and strip centers. We also operate electronic commerce Web sites www.gamestop.com,
www.ebgames.com.au, www.gamestop.ca, www.gamestop.it, www.gamestop.es, www.gamestop.ie,
www.gamestop.de, www.gamestop.co.uk and www.micromania.fr. The network also includes:
www.kongregate.com, a leading browser-based game site; Game Informer magazine, the leading multi-platform
video game publication; Spawn Labs, a streaming technology company; and a digital PC distribution platform
available at www.gamestop.com/pcgames.
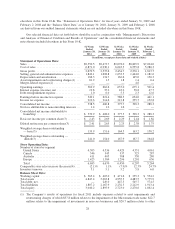
Our fiscal year is composed of 52 or 53 weeks ending on the Saturday closest to January 31. The fiscal years
ended January 28, 2012 (“fiscal 2011”), January 29, 2011 (“fiscal 2010”) and January 30, 2010 (“fiscal 2009”)
consisted of 52 weeks.
Growth in the video game industry is generally driven by the introduction of new technology. The current
generation of hardware consoles (the Sony PlayStation 3, the Microsoft Xbox 360 and the Nintendo Wii) were
introduced between 2005 and 2007. The Nintendo DSi XL was introduced in early 2010 and the Nintendo 3DS
was introduced in March 2011. Typically, following the introduction of new video game platforms, sales of new
video game hardware increase as a percentage of total sales in the first full year following introduction. As video
game platforms mature, the sales mix attributable to complementary video game software and accessories, which
generate higher gross margins, generally increases in the subsequent years. The net effect is generally a decline
in gross margins in the first full year following new platform releases and an increase in gross margins in the
years subsequent to the first full year following the launch period. Unit sales of maturing video game platforms
29