GameStop 2011 Annual Report Download - page 51
Download and view the complete annual report
Please find page 51 of the 2011 GameStop annual report below. You can navigate through the pages in the report by either clicking on the pages listed below, or by using the keyword search tool below to find specific information within the annual report.-
 1
1 -
2
-
3
-
4
-
5
-
6
-
7
-
8
-
9
-
10
-
11
-
12
-
13
-
14
-
15
-
16
-
17
-
18
-
19
-
20
-
21
-
22
-
23
-
24
-
25
-
26
-
27
-
28
-
29
-
30
-
31
-
32
-
33
-
34
-
35
-
36
-
37
-
38
-
39
-
40
-
 41
41 -
 42
42 -
 43
43 -
 44
44 -
 45
45 -
 46
46 -
 47
47 -
 48
48 -
 49
49 -
 50
50 -
 51
51 -
 52
52 -
 53
53 -
 54
54 -
 55
55 -
 56
56 -
 57
57 -
 58
58 -
 59
59 -
 60
60 -
 61
61 -
62
-
63
-
64
-
65
-
66
-
67
-
68
-
69
-
70
-
71
-
72
-
73
-
74
-
75
-
76
-
77
-
78
-
79
-
80
-
81
-
82
-
83
-
84
-
85
-
86
-
87
-
88
-
89
-
90
-
91
-
92
-
93
-
94
-
95
-
96
-
97
-
98
-
99
-
100
-
101
-
102
-
103
-
104
-
105
-
106
-
107
-
108
-
109
-
110
-
111
-
112
-
113
-
114
-
115
-
116
 |
 |

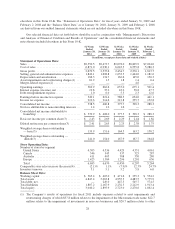
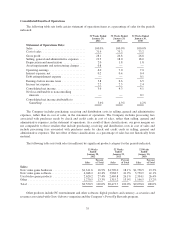
Consolidated Results of Operations
The following table sets forth certain statement of operations items as a percentage of sales for the periods
indicated:
52 Weeks Ended
January 28,
2012
52 Weeks Ended
January 29,
2011
52 Weeks Ended
January 30,
2010
Statement of Operations Data:
Sales ................................... 100.0% 100.0% 100.0%
Cost of sales ............................. 71.9 73.2 73.2
Gross profit .............................. 28.1 26.8 26.8
Selling, general and administrative expenses .... 19.3 18.0 18.0
Depreciation and amortization ............... 2.0 1.8 1.8
Asset impairments and restructuring charges .... 0.8 — —
Operating earnings ........................ 6.0 7.0 7.0
Interest expense, net ....................... 0.2 0.4 0.4
Debt extinguishment expense ................ — — 0.1
Earnings before income taxes ................ 5.8 6.6 6.5
Income tax expense ........................ 2.2 2.3 2.4
Consolidated net income .................... 3.6 4.3 4.1
Net loss attributable to noncontrolling
interests ............................... — — 0.1
Consolidated net income attributable to
GameStop ............................. 3.6% 4.3% 4.2%
The Company includes purchasing, receiving and distribution costs in selling, general and administrative
expenses, rather than in cost of sales, in the statement of operations. The Company includes processing fees
associated with purchases made by check and credit cards in cost of sales, rather than selling, general and
administrative expenses, in the statement of operations. As a result of these classifications, our gross margins are
not comparable to those retailers that include purchasing, receiving and distribution costs in cost of sales and
include processing fees associated with purchases made by check and credit cards in selling, general and
administrative expenses. The net effect of these classifications as a percentage of sales has not historically been
material.
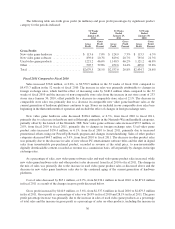
The following table sets forth sales (in millions) by significant product category for the periods indicated:
52 Weeks
Ended
January 28,
2012
52 Weeks
Ended
January 29,
2011
52 Weeks
Ended
January 30,
2010
Sales
Percent
of Total Sales
Percent
of Total Sales
Percent
of Total
Sales:
New video game hardware .................. $1,611.6 16.9% $1,720.0 18.1% $1,756.5 19.3%
New video game software ................... 4,048.2 42.4% 3,968.7 41.9% 3,730.9 41.1%
Used video game products .................. 2,620.2 27.4% 2,469.8 26.1% 2,394.1 26.4%
Other ................................... 1,270.5 13.3% 1,315.2 13.9% 1,196.5 13.2%
Total ................................... $9,550.5 100.0% $9,473.7 100.0% $9,078.0 100.0%
Other products include PC entertainment and other software, digital products and currency, accessories and
revenues associated with Game Informer magazine and the Company’s PowerUp Rewards program.
35